July 1, 2020
Dear Fellow Shareholders,
We said the first quarter of 2020 was one for the record books. While the second quarter did not have the same level of market price volatility, it was an unusual period in that the economic data was highly volatile, yet the market continued to rocket higher. The Federal Reserve’s long list of unprecedented accommodations, which now includes corporate bond purchases, was undoubtedly the driver behind the move. The fastest bear market ever was followed by the largest rally in market history. However, the divergence between economic data and market performance is glaring.
The Federal Reserve has signaled that it may need to do more, and members of Congress have stated their intention to pass another round of stimulus. We believe the latter is probably more impactful to the average American, but the market feeds on both. The S&P 500 rallied almost 40% from its low in March over the next 50 days, handily beating the previous best from 1982 of 35.6%. Rallies of this magnitude have historically signaled a continuation of favorable returns. The prior seven largest rallies were followed by average returns of 10.2% and 17.3% in the ensuing 6-month and 12-month periods, respectively. In fact, returns for those periods were positive 100% of the time.[1] The adage “this time is different” is claimed by both bulls and bears, each of whom have compelling arguments. We are not taking a side. Trying to time the top or bottom of a market is a fool’s errand. We are focused on populating the portfolio with what we believe are great businesses led by great management teams and think that over time this will lead to positive outcomes.
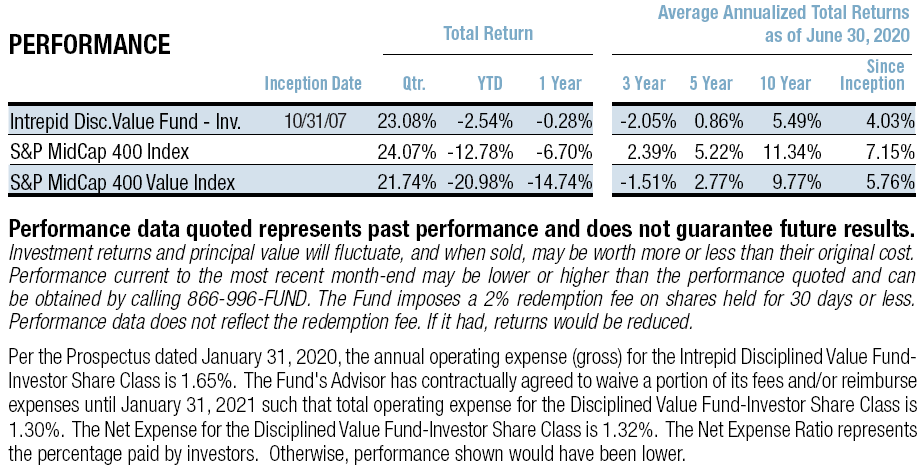
Domestic equity indices all returned in excess of 20% during the quarter. The Intrepid Disciplined Value Fund (the “Fund”) returned 23.08% for the quarter compared to 21.74% for the S&P 400 Midcap Value Index. The S&P 500 returned 20.54% and the Russell 2000 returned 25.42%. We are pleased with how the portfolio 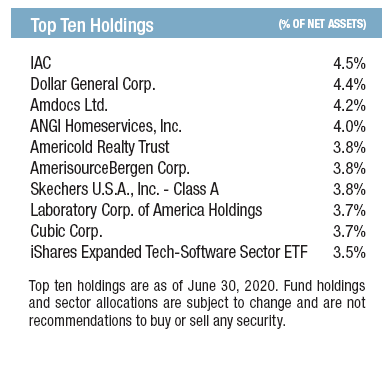
performed, particularly given that cash averaged 10.6% during the quarter. Large-cap equity indices are at or near record levels, however, small and mid-cap indices are still materially below their highs.
Our three largest contributors to performance in the quarter were ANGI Homeservices Inc (ticker: ANGI), IAC/Interactive Corp (ticker: IAC), and Etsy Inc (ticker: ETSY).
IAC/Interactive is a holding company that through its subsidiaries provides media and internet services. IAC owns ~85% of ANGI, so they are part of the same family. IAC through its billionaire chairman, Barry Diller, has a rich history of creating shareholder value having spun off many successful businesses including Expedia, Live Nation (Ticketmaster), Lendingtree, Tripadvisor, and at the end of the second quarter, Match Group (ticker: MTCH). We purchased IAC when its market value was at a $1B+ discount to the value of its stakes in ANGI Homeservices and Match Group, both of which are publicly traded. This implied a negative value for IAC’s other businesses/brands including Care.com which it spent over $400 million acquiring early this year. Resilient results at both ANGI Homeservices and Match Group during the pandemic helped boost shares of IAC during the quarter. ANGI Homeservices’ stock was one of the worst performers in the portfolio up until it was revealed that its business was actually thriving during the pandemic. Service providers turned to the HomeAdvisor platform to look for work and at the same time consumer demand for projects was strong. Data has indicated that this trend has continued through May and June which has helped both ANGI and IAC share prices. Performance for IAC during the quarter also likely benefited from the widely anticipated spin-off of Match Group which took place on June 30th. We have trimmed our ANGI position, but it is still a meaningful weight in the portfolio.
We wrote about adding Etsy to the portfolio in the fourth quarter of 2019—it has been a wild ride since! After initially coming under significant pressure during the market sell-off in March, Etsy emerged as a beneficiary of the environment. The site became the go-to source for face masks after the company encouraged sellers to consider making them. In April, over 12 million masks were sold on Etsy totaling about $133 million in sales. The masks attracted 6.5 million customers during the month (4 million new buyers and 2.5 million buyers who had not purchased on the site for a year or more). The 4 million new buyers were 2.5x the historical monthly rate. This helped buoy sales in more than just face masks. Sales on the site in other categories were up 79% in April compared to the prior year. The momentum has continued leading some investors to believe that there has been a structural shift in consumer behavior due to COVID-19, leaving Etsy as one of the primary beneficiaries. The shares reflect much of this optimism and we have used the strength as an opportunity to reduce the position size.
The largest detractor at only -49 basis points during the quarter was CTO Realty Growth (ticker: CTO). There were no other material detractors.
CTO Realty Growth has a portfolio of income producing properties and other assets such as a 22% interest in Alpine Income Property Trust (ticker: PINE). CTO and Alpine have high exposure to retail tenants and were therefore in the crosshairs of many investors. Shares of CTO remained under pressure after the company disclosed on April 29th that a third of its properties were closed during the shutdown as the tenants were not deemed essential businesses, a third were opened with modified hours/services, and a third were fully open. At that point, only 63% of its tenants had paid rent for the month. We suspect some tenants chose not to pay as they assessed their options related to the various government loan programs and perhaps used the opportunity to potentially negotiate more favorable terms. There are a few tenants that have questionable credit quality, but even if they defaulted CTO should be able to quickly fill the void because we would argue that its properties are high quality and located in attractive MSAs (Metropolitan Statistical Areas). Regardless, CTO’s market value is materially less than its net asset value, even in a distressed scenario, in our opinion. We trimmed the weight of our equity holding due to the continued uncertainty, but we believe the 3.875% convertible bonds due 04/15/25 present a very attractive investment opportunity and, therefore, initiated a position during the quarter.
The Fund exited the quarter at the lowest cash level of the period of 6%. Cash has since increased, and we would anticipate it to continue to increase modestly as many stocks in the portfolio have hit or exceeded our estimate of fair value. Despite the run up in many stocks, we are still finding pockets of value in the market and continue to add new positions. There is a lot of uncertainty in our economy and in the markets right now. Uncertainty breeds opportunity. We look forward to taking advantage of these opportunities as they arise.
Thank you for entrusting us with your capital.
Sincerely,

Clay Kirkland, CFA
Intrepid Disciplined Value Fund Portfolio Manager
[1] Fox, Matthew. “Stocks just had their biggest 50-day rally ever – here’s what they did next after similar gains (SPY).” Markets.BusinessInsider.com, 4 June 2020.