January 6, 2018
“A handful of patience is worth more than a bushel of brains.”
– Dutch Proverb
Dear Friends and Clients,
The new year is always an excellent opportunity to reflect on the past year. In this particular business, we tally up the credits and debits to see what was added to (or subtracted from) our clients’ investment portfolios.
I like the quote at the top of the page because I think it applies to me. I don’t claim to have an abnormally high level of intelligence compared to the average investor, but I have done my best to learn what Howard Marks calls “patient opportunism.” In reflecting on my investing life up to this point, I find that patience may be the most important ingredient for success, if not an absolute requirement. When I have been in too big of a hurry, I have generally paid the price for my haste.
In my own portfolio, I look back and marvel at the $3,000 cost basis Mrs. Travis and I have in shares of Berkshire Hathaway, which we purchased in 1989, the year of our marriage. Today the class A shares of Mr. Buffett’s corporate empire fetch north of $310,000 apiece. I bring this up not to brag, but simply to note that this result took a very long time to achieve – 28 years, to be exact. That is roughly half of the existence of Berkshire Hathaway, which I date to 1965, when Warren Buffett acquired an ailing New England textile mill and set in motion the successful holding company it is today.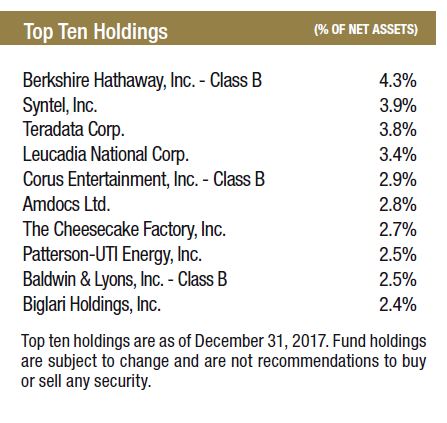
I am afraid that in today’s world of iPhone X’s, Amazon Echos (guilty on both counts), and atrophied attention spans, most investors simply don’t have the patience required to achieve the kind of long-term successful outcome I have had the good fortune of reaping in Berkshire Hathaway. While it certainly has significant benefits, the trend toward virtually “free” investing, either via miniscule commissions or barely visible fees, also encourages hyperactivity, which is the bane of successful long-term investing.
We use third-party performance measurement software at Intrepid that captures the results of both hyperactivity and sloth. I can tell you from scanning this software across our client base over a number of years, sloth usually wins. The aforementioned low-cost barrier to entry and exit gives those prone to hyperactivity a chance to zig, when they should have zagged.
A large part of being a patient opportunist is recognizing the current state of the market and adjusting our decisions accordingly. Today, market conditions remain stubbornly – and excessively – expensive, so our decisions have become more defensive as the market has marched ever higher. To quote Mr. Marks in his timeless book “The Most Important Thing”:
You simply cannot create investment opportunities when they’re not there. The dumbest thing you can do is to insist on perpetuating high returns – and give back your profits in the process. If it’s not there, hoping won’t make it so. When prices are high, it’s inescapable that prospective returns are low (and risks are high). That single sentence provides a great deal of guidance as to appropriate portfolio actions.
So, where does that leave us today? About the same place we were this time last year and the year before that. For the businesses we own, we are waiting as they allocate resources and cash flows in a manner that will hopefully drive the current share price upward toward our best estimate of the “intrinsic value” of the business.
For the remainder of the portfolio that is sitting in cash, T-bills and short-term investment grade bonds, the members of the analytical team at Intrepid Capital continue in their quest to uncover additional investments where they believe there to be a disconnect between “price” and “value.” My one request is that you please be patient with our process as we try to exercise patience ourselves. The process we have built at Intrepid isn’t designed to produce S&P-beating performance every month or every year (any manager who claims to be able to deliver that should be treated with strong suspicion), but we are confident that over a full market cycle, we should be able to deliver attractive risk-adjusted results.
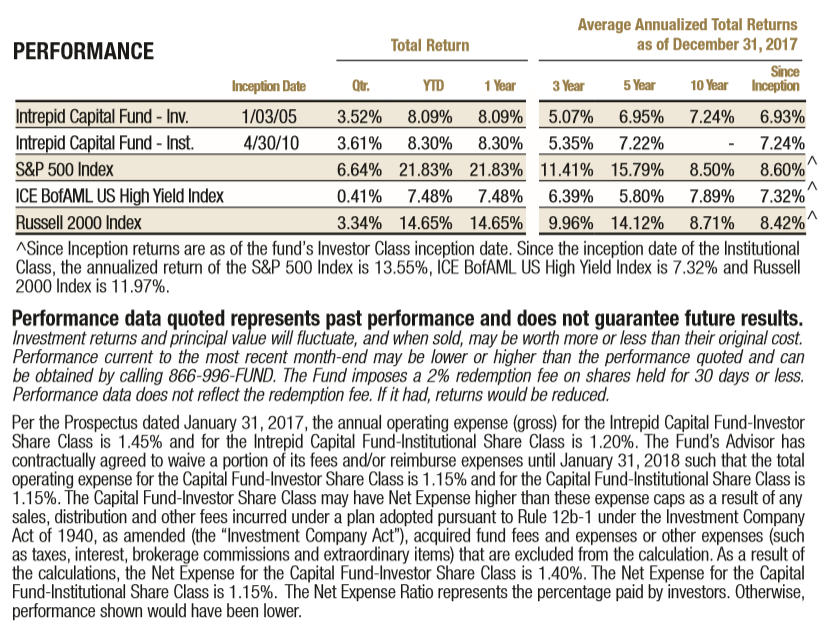
For the period ending December 31, 2017, the Intrepid Capital Fund (the “Fund”) increased 3.52% for the quarter and 8.09% for the year, compared with the S&P 500 Index and ICE BofAML US High Yield Index, which returned 6.64% and 0.41% for the fourth quarter and 21.83% and 7.48% for the year, respectively. The Fund ended the quarter with 15.3% in cash, down meaningfully from last quarter thanks to several new positions purchased in Q4. For the quarter ending December 31, 2017, our most successful investments were businesses where management owned a significant stake in the enterprise. Please note that Berkshire Hathaway is included in this list.
The top five contributors to the Fund for the fourth quarter were HNZ Group (ticker: HNZ CN), Syntel (ticker: SYNT), Teradata (ticker: TDC), Biglari Holdings (ticker: BH), and Berkshire Hathaway Class B (ticker: BRK/B). To be “fair and balanced,” as they say on Fox News, the five biggest detractors were Corus Entertainment (ticker: CJR/B CN), Oaktree Capital (ticker: OAK), Western Digital (ticker: WDC), Dundee Corp. (ticker: DC/A CN), and Stallergenes Greer (ticker: STAGR).
The Intrepid Capital Fund (ICMBX) achieved an overall 4-star Morningstar Rating out of 718 Moderate Allocation 50%-70% Equity funds for the period ending December 31, 2017 (derived from a weighted average of the fund’s three-, five-, and ten-year risk-adjusted return measures). We are pleased to report that over the 10-year period, the Intrepid Capital Fund (ICMBX) has outperformed 89% of the 477 funds in the aforementioned peer group, based on total returns. Morningstar ranked the Fund in the 96th, 80th, and 11th percentile out of 810, 670, and 477 Moderate Allocation 50%-70% Equity funds for the one-, five-, and ten-year periods ending December 31, 2017, respectively.
Thank you for entrusting us with your hard-earned capital; it is not a position we take lightly. If there is anything we can do to serve you better, please don’t hesitate to call.
Best regards,
Mark F. Travis
President
Intrepid Capital Fund Portfolio Manager