October 3, 2019
“The times they are a changin’.”
~ Bob Dylan
Dear Friends and Clients,
As a lifetime participant in the financial services business, I have heard more times than I care to count the often repeated and almost never heeded disclaimer, “Past performance is no guarantee of future results.” Unfortunately, many, if not most, market participants use recent performance (1-5 years) as the basis for choosing how to allocate their capital. The reality, with tongue in cheek, is that most investors buy high and sell low by extrapolating recent performance – good or bad – into the distant future when making investment decisions.
Study after study has shown that investors pour their money into strategies and companies that have done well recently, whether in terms of absolute performance or relative performance vs. peers, and pull money out of short-term underperformers, kneecapping their own long-term returns in the process.
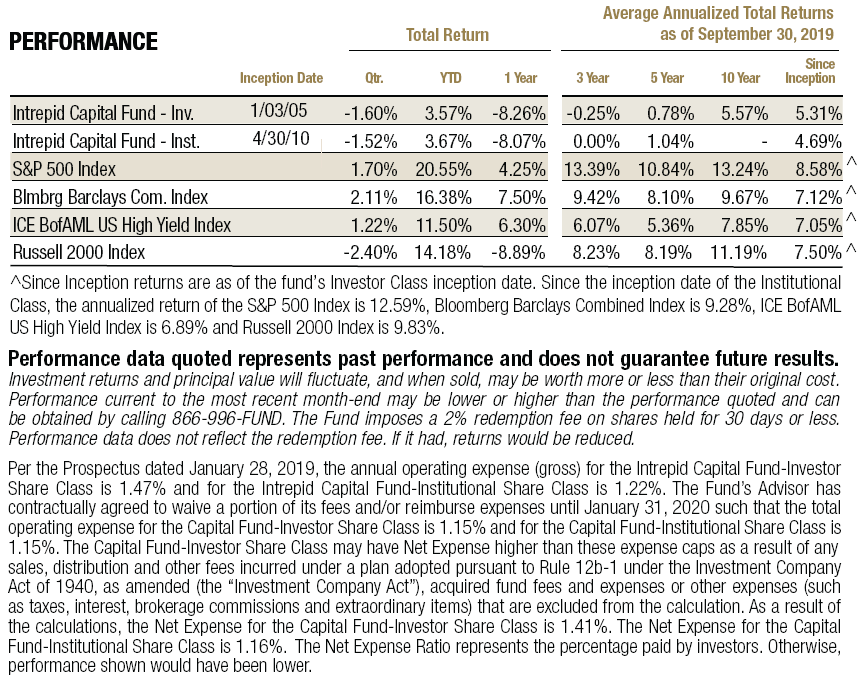
 Consider the past year. For the twelve months ending September 30, 2019, the S&P 500 (US large cap companies) was up 4.25% and the Russell 2000 (US small cap companies) was down 8.89%. US large caps have been one of the best performing asset classes globally for the last several years, so it should come as no surprise that over roughly the same twelve-month period (Morningstar data is only available through August) an estimated $93.2 billion of net asset flows have gone into passive US large cap funds, chasing better relative performance, while a net $131 million has come out of US small cap index funds.
But what about long-term performance? If you expand the investment horizon to 20 years (Sept. ’99 – Sept. ’19), which encompasses both two bear markets and two bull markets, the results are quite different. Annualized returns over the full 20 years were 6.33% for the S&P 500 and 7.99% for the Russell 2000. 164 basis points may not seem like much, but if you were to put $1 million in funds tracking each index in 1999, you’d have $4.6 million today in the Russell and $3.4 million in the S&P – a $1.2 million difference!
I bring this up because we at Intrepid Capital have concentrated the majority of our research efforts on the smaller end of the US market, typically in the $500 million to $10 billion range. We further narrow our playing field to profitable businesses trading at a discount to their reasonable private market fair value, which puts our sweet spot squarely in what Morningstar considers a small cap value or mid cap value style box. That our niche lies in this less efficient, less competitive corner of the capital markets is no accident. We believe it is partly because of these traits that small stocks have historically outperformed their larger brethren and value has beaten growth over most decade-plus periods.
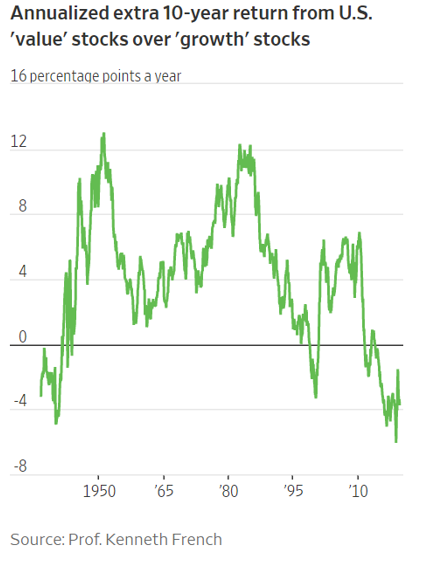 The accompanying graph from the Wall Street Journal[1] going back to 1936 shows that over most 10-year historical periods, a preference for stocks with lower valuations has produced significant outperformance over stocks with higher growth but also more demanding valuations. However, value as an investing style is currently in a historic 10-year slump relative to growth, the likes of which we haven’t seen since the late ‘30s. The underlying factors that have favored growth stocks over the last decade – Fed-induced low interest rates, loose monetary policy, and unrestrained corporate borrowing, among others – I have bemoaned at length in past letters and will not repeat here. The bottom line, in the Journal’s words, is that a “value bounce [seems] overdue.”
Keen observers will point out that with higher return comes higher risk. This has generally been the case with small caps, but as value investors, we try to hunt in what we regard as a less efficient part of the stock market for high-quality and hopefully mispriced shares. Our goal is to generate high returns with less volatility than the broad market indexes.
This has admittedly been a difficult period for the Intrepid Capital Fund (the “Fund”). Frankly, a stretch of 60 months with barely visible returns will try the patience of any shareholder, present company included. However, if we look at the long term history of the S&P 500 Index, which happens to be the equity portion of the Fund’s benchmark, there has been one other brief “flat spell” with a negligible 5-year return (early 2009), as well as two multi-year periods (2002-2006 and 2009-2013) where the S&P 500 hadn’t made any money over the trailing five years.
But just as we wouldn’t expect periods with high double-digit performance to last indefinitely, whether it be mutual funds or indexes, neither do we expect periods with flat returns to continue unabated. The markets move in cycles, and as the old Persian fable says, “this too shall pass.” The disclaimer about past performance applies whether one is observing 5 years of hot performance or 5 years of lackluster performance!
 We did see some life breathed into the share prices in many of our companies in mid-September. A dramatic rotation from momentum strategies into value strategies gave us hope that perhaps investors’ mentality toward risk was beginning to turn. I came to discover after this shift in sentiment that some of the recent market favorites hadn’t done so well. Amazon (ticker: AMZN) and Netflix (ticker: NFLX), both members of the tech darling “FAANG” stocks, found their share prices down 8% and 27%, respectively, in the third quarter. This is a small consolation for your portfolio manager, who delivered a negative 1.60% return for the same period.
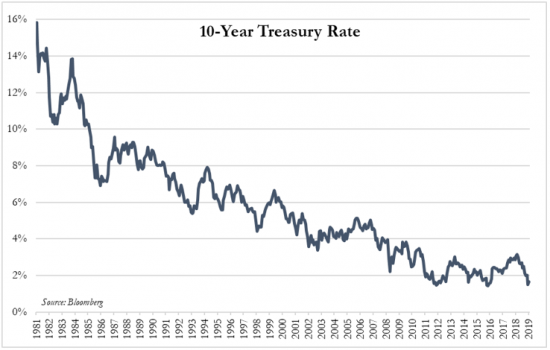
The common theme between strategies that have fared best over the last year is duration¸ which can be thought of in terms of payback period or interest rate sensitivity. As interest rates plummet, the market’s mantra seems to be the more duration the better. Long duration investments – those with longer payback periods – have benefitted from a bull market in bonds that resumed around the Fed’s July rate cut, the first in 10 years, but really began in 1981, when 10-year Treasuries offered a 15% government-guaranteed coupon (and no one wanted them back then, by the way!). Compare that to today, with “investors” clamoring to buy 10-year Treasuries with a 1.5% yield. As an example of the effect this year’s sharp drop in rates has had on longer-duration bonds, the holder of a 30-year Treasury bond at the end of 2018 would have seen a 20% return by the end of September!
But duration doesn’t only apply to bonds, as Jim Grant, editor of the Grant’s Interest Rate Observer newsletter, pointed out in a recent issue. “By definition,” he writes, “every common stock is a perpetual [no defined payback period] security. But growth issues carry a longer imputed duration than value names, because so much more of their anticipated payoff lies over the temporal horizon. The bond bull market has not smiled on fixed-income investors alone. It’s showered its riches on Silicon Valley, the private-equity business and the venture-capital community as well.”
To truly understand duration, though, we also have to understand the problematic implications of ultra-low or negative interest rates, which are the new norm in Germany, Japan and elsewhere. Just think, you could lend your money to the German government for as long as 25 years today in exchange for the “privilege” of getting less money back at maturity. No, I am not making this up!
Would you invest $1,000 today to get $1,000 back a year from now? Most people would answer no; they’d rather keep the money unless they expect to receive more back in the future. Time value of money tells us that a dollar in the future is worth less than a dollar today, and the difference is determined by a discount rate – the implied return an investor demands in exchange for waiting to receive his dollar back. As the required rate of return rises or the payback period gets longer, the present value of that future dollar gets smaller. Conversely, as the required rate of return falls or the payback period gets shorter, the investor should be willing to pay more for the future dollar today. In other words, those expected future dollars become more valuable.
But what happens when the prevailing rate of return demanded by the market falls close to zero or even negative? Not only does lending or investing a dollar today to get less back in the future defy common sense, but it distorts the whole relationship undergirding cash flow-based valuation. With a 0% discount rate, duration (payback period) becomes irrelevant, because a dollar returned 20 years from now is worth just as much as a dollar today.
The point of this theoretical exercise is that cheap credit matters in everything. Unprofitable companies like Netflix or Uber (ticker: UBER) have economic value today because at some point in the future, their shareholders expect them to begin generating cash instead of burning it. For each of these companies and most of the ones that have gone public in the last few years, profitability is a distant prospect. But in a world where the benchmark 10-year Treasury dipped below 1.5% a few weeks ago and $17 trillion of debt globally sported negative interest rates at the end of August, those far off “maybe dollars” are worth almost as much in the minds and spreadsheets of investors as an actual dollar today – a situation that, in theory, justifies massive valuations for these companies but would never be sustainable in a more normalized rate environment.
I believe this is an “emperor has on no clothes” moment in the market, one that years hence we will look back on incredulously. Rate suppression activity by central banks around the world has encouraged all sorts of shenanigans to persist, in my opinion, from financing larger U.S. budget deficits, to unicorns like WeWork, to an IPO market of largely unprofitable offerings.
The potential for capital destruction is huge if rates were to actually rise instead of continuing to fall, as is the Fed-driven consensus belief today. Even “safe” investment grade bonds stand to suffer more than they would have historically, as the average issue’s duration has drifted up to 3x its coupon. Said another way, a 1% increase in rates would wipe out 3 years’ worth of interest payments.
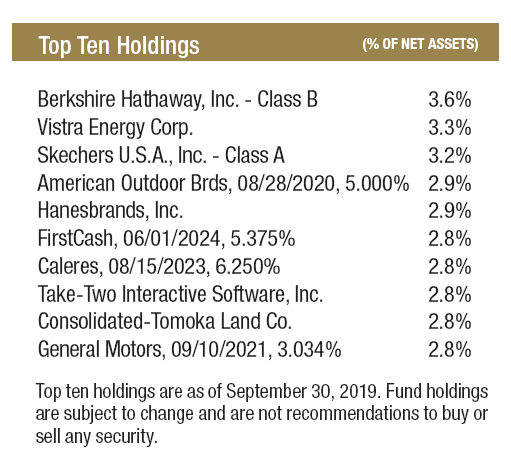
The way we intend to help mitigate this risk in the Fund is to take a lot of “4-foot putts” with a mix of cash, short duration corporate bonds that should be paid back within a year or two, and carefully selected stocks that should, in our opinion, generate high levels of free cash flow relative to their market cap and enterprise value. Holdings in the Fund with these characteristics include companies like Skechers (ticker: SKX), Hanesbrands (ticker: HBI), Vistra Energy (ticker: VST), and SP Plus (ticker: SPP), all of which we have discussed in past letters. Shares of companies that make money from shoes, underwear, electricity and parking lots and that generate healthy free cash flow should aid us if and when interest rates rise.
For the three months ended September 30, 2019, the Fund’s largest contributors were Vistra Energy (ticker: VST), Skechers (ticker: SKX), and SP Plus (ticker: SPP). The largest detractors Cabot Oil & Gas (ticker: COG), Garrett Motion (ticker: GTX), and FRP Holdings (ticker: FRPH).
For the twelve months ended September 30, 2019, the Fund’s largest contributors were Skechers (ticker: SKX), Dollar Tree (ticker: DLTR), and Wyndham Destinations (ticker: WYND). The largest detractors were Net1 UEPS Technologies (ticker: UEPS), Royal Mail (ticker: RMG LN), and Hornbach Baumarkt (ticker: HBM GR).
Thank you for your continued support. If there is anything we can do to serve you better, please don’t hesitate to call.
Best Regards,

Mark F. Travis, President
Intrepid Capital Fund Portfolio Manager
[1] Mackintosh, James. “Value’s Rebounding, but Don’t Get Your Hopes Up.” WSJ.com. 14 Sept 2019. Web. Accessed 3 Oct 2019.