July 9, 2018
“Out of the frying pan and into the fire.”
Dear Fellow Shareholders,
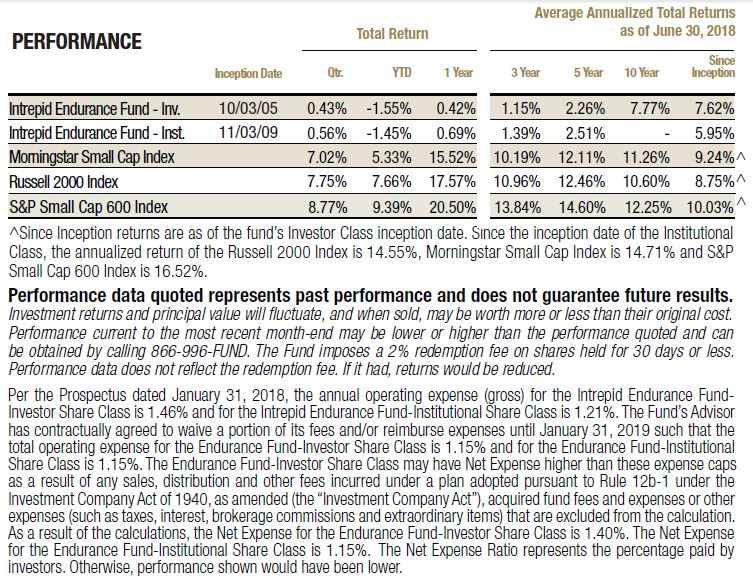
Small cap stocks rallied during the second quarter along with technology shares. The Russell 2000, S&P Small Cap 600, and Morningstar Small Cap Index were up 7.75%, 8.77%, and 7.02%, respectively, over the three-month period ending June 30, 2018. Many investors believe smaller companies offer a haven from trade wars, given their lower foreign revenue exposure compared to large cap companies. Additionally, investors appear to have “re-remembered” that domestically-focused businesses will enjoy a greater benefit from U.S. tax reform. We believe the rush toward riskier assets will prove to be a critical mistake.
There are few safe places to hide in today’s market. Small cap indexes are not one of them, in our opinion, so beware of rotating from pricey large caps into pricier smaller securities. The magnitude and pervasiveness of overvaluation across domestic equities is frequently obfuscated by bad data and an overreliance on statistical weighted averages. The bad data includes treating dependably aggressive forward estimates as actual earnings, removing from income extraordinary charges that seem to repeat every year, and excising unprofitable companies from P/E ratio statistics. The dependence on major stock market averages might work for the typical index investor, but it makes little sense for small cap investors and those pursuing true active management.
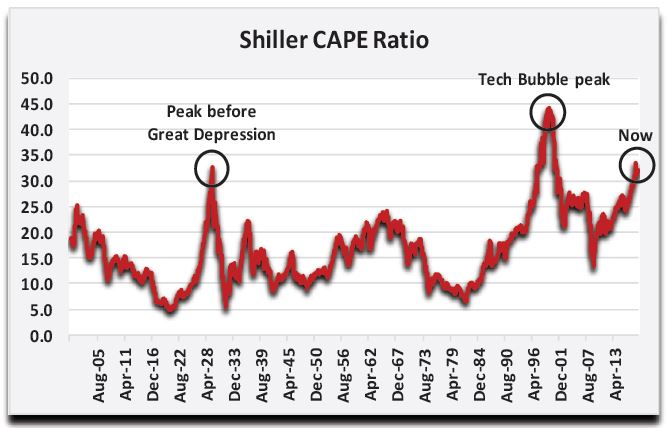
The technology bubble that popped in 2000 is regarded as the biggest stock market bubble in history. Thoughtful valuation metrics such as Robert Shiller’s CAPE Ratio[1] for the S&P 500 show the tech bubble to be in a world all its own, with today’s market tying 1929 as the second richest market ever. Second richest ever…. that alone should be enough to give serious investors pause. However, there’s more to this story.
The S&P 500 is an index dominated by its largest members. Today, that list is led by Apple, Amazon, Google, Microsoft, and Facebook. At the tech bubble peak, it was Microsoft, Cisco, General Electric, Intel, and Exxon Mobil. Back then the top 30 companies accounted for half of the market cap of the entire index, whereas it takes 50 companies today. On March 24, 2000, when the broader market peaked during the tech bubble, the S&P 500 P/E was 29.2x versus 23.7x when we ran the numbers a few weeks ago (June 21, 2018). Nevertheless, median statistics paint a different picture, and one that’s more harrowing for active managers.
 The median P/E of the S&P 500 at the top of the tech bubble was 18.9x, whereas the current median P/E is 24.1x. Therefore, the typical big cap company is trading at a higher multiple than it was during the biggest bubble in history. As an investor, maybe this would concern you, and maybe not. If you’re unmoved, then try this on for size. At the market’s peak in 2000, the median P/E of the Russell 2000 small cap index was 18.4x.[2] Today, the median small cap P/E is 38.5x—a double over 18 years.
 It was the opinion of many value managers, including Intrepid Capital, that cheap stocks were available in the late 1990s, even though many companies were trading for obscene prices. Within the lowest P/E quintile for the Russell 2000 at the apex of the tech bubble, the median nonfinancial company traded for 14x free cash flow. Currently, the lowest quintile P/E stocks in the Russell trade for a median free cash flow multiple of 24.8x. It’s much harder to find value now even when you’re looking in the right spots. Small public companies are more indebted today, and they are more likely to be unprofitable (33% of the index now versus 23% then).
Contrary to popular belief, lower tax rates do not support today’s heady small cap multiples. Russell 2000 members derive 20% of revenue from foreign sources, which is only about 10% less than large caps. They also import many products that could be affected by trade war-related tariffs. Some major small cap-heavy industries that have less foreign exposure, like banks, are the most cutthroat and will see diminishing benefits from tax reform through good old-fashioned competition. Rising interest rates also present a strong counterweight to falling tax rates, given the high leverage of many small caps. The Net Debt/EBITDA for the nonfinancial portion of the Russell 2000 is 4.8x, while the median net leverage ratio is a hefty 3.6x.
Top-line growth isn’t likely to be investors’ savior either. If our economic growth is entirely financed by debt, is our prosperity real? Over the past ten years, it has taken $3 of incremental debt to drive every $1 of GDP growth.[3] Perhaps the GDP Multiplier should be renamed the Debt Divider. The dependency of our nation’s economy on borrowing isn’t healthy, and if past is prologue, it will end with severe consequences.
U.S. small caps have never been more expensive, and the positioning of our portfolio reflects this environment. The Intrepid Endurance Fund (the “Fund”) increased 0.43% during the second quarter and ended the period with 82.7% of assets held in cash and Treasury bills. If small cap benchmarks continue to rise in the near-term, it will be very difficult for the Fund to keep pace. We are prepared for market turmoil and a return to saner valuations. We believe the best approach is to own overlooked and uncorrelated securities. Recently we have found some value in the financial sector. In the absence of equity opportunities, Treasury bills yielding 2% are a good alternative in the current environment.
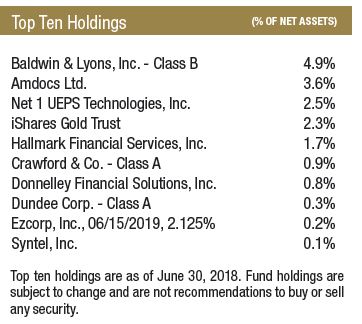
The Fund’s top two contributors in the second quarter were Baldwin & Lyons (ticker: BWINB) and Hallmark Financial Services (ticker: HALL), two companies focused on commercial auto insurance. Both firms earned an underwriting profit in the first quarter, following a very tough 2017 that included significant adverse reserve developments. Baldwin’s shares appreciated after the resignation of its Executive Chairman, who is also a controlling shareholder and manages a hedge fund focused on insurance stocks with a successful track record. Other shareholders may believe his departure reduces tension between management and the board. Both Baldwin and Hallmark continue to trade at a discount to tangible book value, and we feel they are a reasonable place for our capital while we seek compelling opportunities.
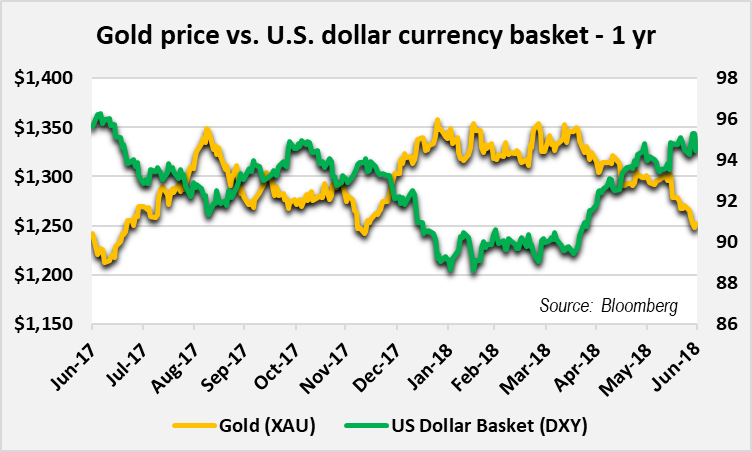
The Fund’s top three detractors were the iShares Gold Trust (ticker: IAU), Retail Food Group (ticker: RFG AU), and Net 1 UEPS Technologies (ticker: UEPS). Each of these contributed slightly more than the 10 basis point minimum negative impact we have defined for us to disclose them. Retail Food Group is discussed later in the letter. Gold prices sank in the second quarter due to rising interest rates and the strength of the U.S. dollar. Gold exploration spending is down, and production is becoming more challenging as the easy reserves have been mined. We expect loose monetary policy and a favorable supply and demand backdrop to help drive up gold prices in the long run; however, in the nearer term we also believe our gold position could flourish when other assets are in disarray.
Net 1 UEPS Technologies’ (UEPS) stock rose sharply after first quarter earnings when the company reported the addition of several hundred thousand new customers for its EasyPay Everywhere banking offering, which will help offset the loss of the welfare distribution contract from the South African Social Security Agency. However, the shares gave back all those gains as the media continued to paint the company as a villain as it transitions the welfare contract to the South African Post Office (SAPO).
Predictably, it was reported today that hundreds of welfare recipients couldn’t receive their grants due to a strike by Post Office workers for higher wages. UEPS never failed to deliver grants on time when it administered the entire contract. Whatever the case, our investment in UEPS is buttressed by the company’s balance sheet and ownership of the third largest South Korean payments company, which have a current combined value that exceeds UEPS’ stock price. The firm’s continued provision of financial services to the underbanked population in South Africa would just be a bonus for us.
We acquired two new small positions during the quarter and sold one. We purchased Crawford & Company (ticker: CRD/A) and Donnelley Financial Solutions (ticker: DFIN). Crawford is one of the world’s largest independent providers of claims management services to insurance companies and self-insured entities. The company’s stock has underperformed for years due to weak top line growth, substandard margins, an underfunded pension, a muddied financial picture, and a dual class share structure. An aggressive restructuring program has significantly improved underlying profitability and the pension’s status is much-improved.
However, a declining contribution from administering the BP oil spill class action has overshadowed margin gains in Crawford’s core outsourced claims management and third-party administration franchises. The recent sale of the underperforming class action business helps simplify the story. We acquired Crawford’s shares at 5x EV/EBITDA. Competitors have been acquired recently at over twice that multiple. Crawford is selling for just over 10x estimated leveraged free cash flow.
Donnelley Financial Solutions, or DFIN, was spun off from the 150-year-old commercial printing company R.R. Donnelley in October 2016. DFIN supports the global capital markets compliance and transaction needs for corporations and their advisors and the investment management compliance requirements of mutual funds. DFIN helps companies comply with ongoing regulatory filings and deliver printed communications to investors, and it also provides language translation services. This creates a strong recurring revenue base (60%) to support the more volatile transactional revenue DFIN receives as a leading provider of data room solutions for corporate IPOs and M&A.
DFIN still derives 40% of revenue from lower-margin legacy printing services, which are in structural decline, but this is being offset by fast-growing software and services. The shares had significantly underperformed since the spinoff due to volatility on the transactional side. We picked up a small position near the lows at a double-digit free cash flow yield but stopped buying when the stock rebounded due to sabre rattling from two small activist investors.
We sold Retail Food Group, the restaurant franchisor, during the quarter. Men at Work put it best, “Do you come from a land down under?…You better run, you better take cover.” In last quarter’s letter, we informed you that we were performing additional diligence on the name. We shipped two of our brightest blokes to Australia for a walkabout to uncover the real story on Retail Food Group (RFG).
They witnessed a kangaroo get plowed by a speeding Jeep in the bush, but that wasn’t their most frightening encounter. Maybe it was the fact that they couldn’t find a single franchisee who was happy with the parent company. Or perhaps it was the call a few days into the trip from RFG’s CEO, who warned us not to “intimidate” franchisees by politely asking them about their satisfaction. No, the final straw had to be a meeting with top management that was conducted in a dimly lit old nursery, where the only chairs were preschool-sized. Crikey! That up-close encounter made it clear that the people leading the firm were either incredibly dishonest or a few sausages short of a barbie. We bailed immediately.
It’s not hard to determine where we went wrong on this investment. We bought the shares when they nosedived during an aggressive smear campaign by the media. We were able to internally disprove some of those accusations. We thought this meant the other claims were less likely to be credible or were blown out of proportion, and we felt we had a margin of safety in the relatively stable franchise royalty stream and unrelated wholesale business. Unbeknownst to us, the franchisee base was disintegrating. We didn’t reach this conclusion until we traveled from store to store in Australia. While our exit was painful and marred performance earlier this year, we have avoided additional steep losses by selling when we did.
The Fund’s Primero Mining convertible bond was retired at par in May upon the completion of the takeover of the company by First Majestic Silver.
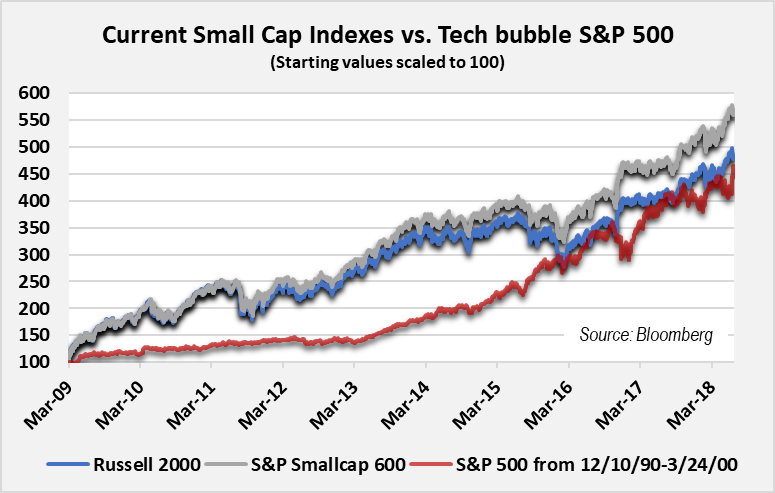
Did you know that the performance of the U.S. small cap market since the 2009 trough is greater than the performance of the S&P 500 leading up to the peak of the tech bubble?[4]
The S&P more than doubled its EPS over the nine-year period before the crash, while there has been minimal underlying EPS growth for small cap benchmarks. The small cap figures are admittedly diluted by unprofitable companies. Not every small cap is a speculation or massively overvalued today, but the majority are, in our opinion, with the average company trading for 38x earnings and over 17x EBITDA.
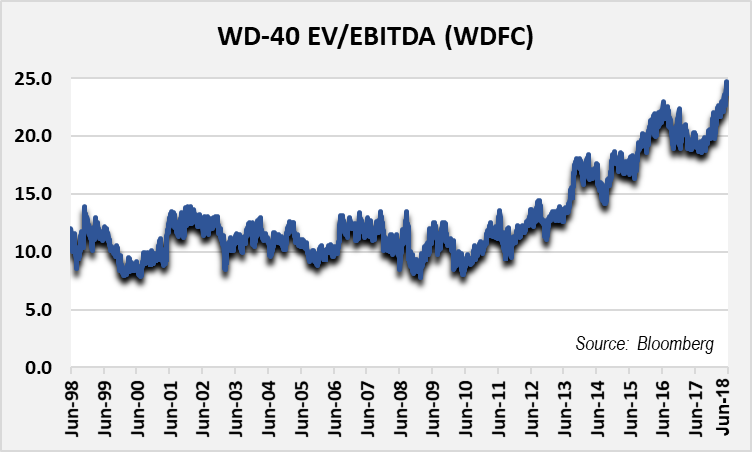
Take WD-40 (ticker: WDFC) as one example. It’s a great business with a brand familiar to everyone. Over the last 20 years the company has grown EBITDA at a 4.1% compounded annual rate, which isn’t spectacular but works just fine for us. We have owned this stock before, and we’d like to own it again. In the ten-year period prior to this market cycle (1998 through 2008), WD-40’s shares traded for an average of 11x EBITDA. It’s rare for WD-40 to ever trade at conventionally “cheap” multiples because of the high quality of the business. Its earnings are very predictable. As of June 30, 2018, WD-40 traded for 24x trailing EBITDA. This level of multiple expansion is the norm in this environment, not the exception.
The length and extremes of this bull market have created difficult circumstances for absolute return investors. While our relative performance in quarters like this one can be a difficult pill to swallow, we are confident in our time-tested investment process, which has excelled in prior full market cycles. Right now, the Fund is operating in a state of guerrilla warfare: watching the action closely and quietly from the periphery, under the canopy of the jungle, and intermittently engaging when we identify opportunities. We stand ready to launch a full offensive when the conditions are right.
The S&P 500 plummeted almost 50% from the tech bubble peak, and its constituents were more reasonably valued at that time than small caps are today. It will be tough to avoid a major drawdown unless you are invested in products uncorrelated to benchmarks that have the flexibility to adopt a defensive posture when conditions warrant it. We believe the Intrepid Endurance Fund fits the bill, and our personal finances and those of our family and friends are deeply invested in the success of this portfolio and Intrepid’s process. For anyone contemplating shifting money from large cap index funds into small cap index funds or from defensive portfolios into aggressive ones under the belief that it’s a better home for their capital, we would urge caution at this stage of the market cycle. Don’t jump from the frying pan into the fire.
Thank you for your investment.
Sincerely,

Jayme Wiggins, CFA
Chief Investment Officer
Intrepid Endurance Fund Portfolio Manager
[1] Shiller, Robert. Online Data Robert Shiller. Yale University. www.econ.yale.edu/~shiller/data. Accessed 9 July 2018. Cyclically-adjusted P/E Ratio calculated as price divided by 10-year average earnings, adjusted for inflation.
[2] The Russell 2000 actually peaked on March 9, 2000, but we lined up the data retrieval with the S&P 500’s peak
[3] Includes nonfinancial sector business, household, and government debt as tracked by the Federal Reserve
[4] All indexes use the same number of days. For the S&P 500, the line chart reflects performance from December 10, 1990 through the market top on March 24, 2000. For the Russell 2000 and S&P Small Cap 600, the period is March 9, 2009 through June 30, 2018.