October 5, 2018
“Life can only be understood backwards; but it must be lived forwards.”
~ Soren Kierkegaard
Dear Friends and Clients,
As I look at my Bloomberg terminal and read the quote above from Soren Kierkegaard, it seems appropriate as I reflect on our portfolio performance over the last twelve months. Looking at pedestrian investment results in what appears to be a roaring bull market is as frustrating for me as it is for you. But as the old idiom goes, you can’t unring a bell – as much as I might want to.
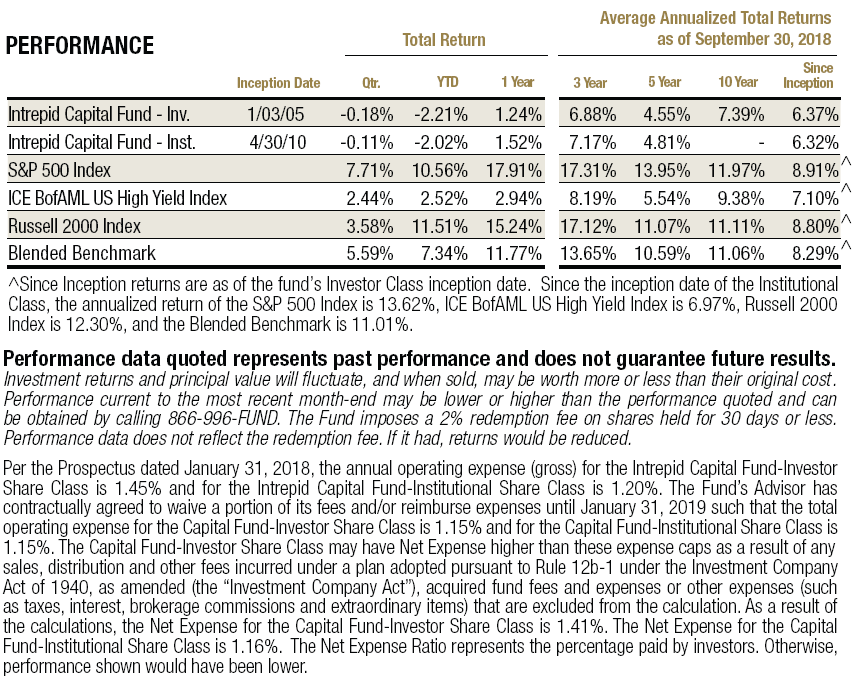
For the one-year period ending September 30, 2018, the Intrepid Capital Fund (the “Fund”) increased 1.24% compared to gains of 15.24% for the Russell 2000, 17.91% for the S&P 500 Index, and 11.77% for the Fund’s Blended benchmark, which consists of 60% S&P 500 and 40% ICE BofAML High Yield. Now might be an appropriate time to restate the investment objectives of the Fund. Its primary objective is long-term capital appreciation and high current income, emphasis on the long-term. The Fund is categorized by Morningstar® as Allocation – 50% to 70% equity. This is what we refer to as a balanced strategy, which consists of holdings in cash (T-bills), stock and bonds.
While many investment managers and their clients still measure performance by how much they outperformed or underperformed the S&P in a given period, I have long argued that investors can’t eat relative returns. For that reason, the Fund focuses first and foremost on absolute return. Our primary goal is to generate sustainable positive results to meet our shareholders’ objectives. Whether those objectives are related to retirement, education, philanthropy, or other aspirations, “outperforming” by losing less than a falling benchmark doesn’t help make forward progress toward any goal.
The allocation in the portfolio tends to cluster around 60% in equities of various market cap sizes, with the remaining 40% in shorter-maturity fixed income. However, our equity allocation can range from 45% to 70%, depending strictly on what qualifying investment opportunities are available. We have found, along with others in the industry, that this mix tends to generate attractive risk/return characteristics and enable shareholders to weather times of financial adversity without buckling and abandoning their strategy. Industry data shows that investors in this type of strategy tend to have longer average holding periods than the typical equity fund investor.
The most distinctive factor that sets apart the equity holdings of this or any of our mutual funds is our rigorous process of determining what the underlying company is worth and the strict requirement that we don’t purchase stocks unless they trade at a significant discount to that fair value. For fixed income, we want to determine how we will be repaid if we lend money to a company over a relatively short time frame.
Other distinguishing characteristics of the Fund include:
- Our investment horizon is long-term. In some cases, we’ve patiently owned a company for 3-5 years as our thesis plays out or the business steadily compounds value. We think this gives us a distinct advantage over many managers who may hold positions for a few months or less, resulting in higher portfolio turnover, transaction costs, and taxes.
- We construct more concentrated portfolios than many of our balanced fund peers. If we find an attractive business and believe a significant disconnect exists between its price and intrinsic value, we like to own a lot of it.
- Our mandate allows for a variety of equity market caps, and the Fund usually holds a mix of small, medium and large capitalization stocks. In addition, up to 25% may be companies not domiciled in the U.S. By my estimation, that gives us a potential of over 12,000 equity securities from which to choose – about 4,300 in the U.S., the rest in other developed markets around the globe.
- Lastly, we are not driven to invest based on the sector breakdown or other characteristics of a given benchmark index. The portfolio can and will differ from the indexes, particularly over shorter time frames, based on where we’re finding pockets of value.
As a fiduciary, co-investor and portfolio manager for the last 24 years, I can only recall the period known as the Tech Bubble in the late 1990’s where I felt as out of touch and left in the dust by the equity market as I do today. It is interesting to see some of the similarities in market performance, then and now.
Almost exactly 20 years ago (September 1998) the Federal Reserve, under Alan Greenspan, coordinated a bailout of Long Term Capital Management (LTCM), a very large, very levered hedge fund on the brink of collapse. LTCM was trading for many multiples of fund equity with the assistance of leverage and several Nobel Prize-winning economists and renowned Wall Street traders, and it nearly collapsed the global financial system in 1998. Between mid-July and early October 1998, the LTCM crisis fallout drove the Russell 2000 and S&P 500 down 32.6% and 18.8%, respectively.[1]
I bring this up as a reminder that prices can go down, often much quicker than they ascended. I am certain there is more leverage in the financial system today than at the start of this bull market, aided by the Fed’s interest rate suppression. While households seem to have “gotten religion” since the financial crisis – personal debt levels are well below 2007 highs – corporations have gorged themselves at the feeding trough of cheap debt, enabled in part by seemingly insatiable investor demand for any fixed income instrument yielding more than 1%.
Many of those companies are already feeling the pinch of rising rates, especially the ones that borrowed with floating rate loans. The 10-year Treasury touched a low rate of 1.36% in July of 2016; today the 10-year Treasury yields 3.23%. The Federal Reserve is currently forecasting three more increases in rates in 2019. My guess is that at some point, the companies that have borrowed most heavily over the last decade will ultimately put that decision in the “it seemed like a good idea at the time” category!
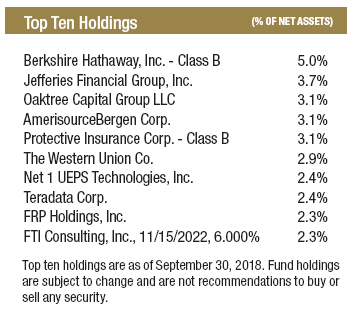
Our results in the Fund over the last year were suppressed by the three largest detractors, which reduced the Fund’s return by approximately 3.50%. Corus Entertainment (ticker: CJR/B CN) is a Toronto-based broadcaster that merged with sister company Shaw Media (the chairman of Corus is Heather Shaw). Although Corus has a dominant share of women and children’s television programming in Canada, including broadcast rights to HGTV, Food Network, Disney Channel, Nickelodeon, and other top-tier programming, the additional leverage from the acquisition of Shaw Media coupled with falling advertising revenue and management’s unwillingness to reduce their dividend gave us enough reason to make the decision to sell earlier in the year.
Retail Food Group (ticker: RFG) is an Australia-based franchisor of fast food coffee, donut, and pizza shops. RFG had many of the characteristics we like in a business but had been painted as a villain by several Australian media outlets. Unfortunately, after a pair of Intrepid research analysts spent two weeks “down under,” we realized the claims of franchisee mistreatment were true. Their meeting with management only worsened our doubts, and the CEO was unwilling to consider backing up his claims that the stock was undervalued by buying back shares, even at depressed prices. We completely exited this position during the second quarter and avoided significant additional losses by selling when we did.
Net 1 UEPS Technologies (ticker: UEPS) is a company providing payment solutions for un-banked individuals around the world. UEPS lost a contract several years ago to deliver welfare money electronically for the South African government, and the revenue stream is finally rolling off after extended delays in getting the South African Post Office up to speed as the replacement vendor. We believe the sum of the parts of UEPS’ balance sheet is much higher than the current share price. We will continue to hold and monitor this security.
The top three contributors for the one-year period ending September 30, 2018 were Syntel (ticker: SYNT), Greenhill & Co. (ticker: GHL), and Discovery, Inc. (ticker: DISCK).
On the fixed income portion of the portfolio, Jason Lazarus, CFA has steered us away from the negative results of fixed income benchmarks with careful selection of shorter-term bonds. We continue to opportunistically invest in high yield issues when we can capture enough incremental spread to justify a step up in credit risk, but high yield debt trades today at the lowest spread over Treasuries in the post-financial crisis era, barely over 3%.
Because of this poor risk/return tradeoff, roughly 20% of our bond holdings today are investment grade notes maturing in the next year or two, and the Fund’s average expected payback period, as measured by duration, is well under two years. This positioning has paid off, as our fixed income holdings are positive year-to-date against a backdrop of the Bloomberg Barclays Aggregate Bond Index being down 2.53%.
We realize many of you are frustrated with our shorter-term results, and as your portfolio manager, trust me when I say I am right there with you. While we have had a few minor missteps, we believe that our risk-controlled process should generate attractive long-term returns and that we can recover from the recent underperformance.
Thank you for your continued support.
Best regards,

Mark F. Travis, President
Intrepid Capital Fund Portfolio Manager
[1] Returns quoted are for the period of July 17, 1998 to October 8, 1998