“The quickest way to double your money is to fold it in half and put it in your back pocket.”
~ Will Rogers
Dear Friends and Clients,
One of the lessons I have learned in rehabilitating various parts of my body is that often the real problem is not at the site of the pain. Consider the pain generated in various financial markets around the globe. Argentina has seen its peso lose 36% of its value against the dollar so far this year. Italy, with the third highest government debt to GDP in the developed world, is in the midst of a political crisis that has crushed government bond prices. A streak of soft economic data and trade war fears have pushed China’s stock market down more than 20% since its January peak. These problems certainly have origins in local markets and the choices their politicians have made. However, I believe the trigger may originate here in the good ol’ USA!
The smoke has cleared from the Federal Reserve’s double-barreled shotgun of zero interest rates and Quantitative Easing (QE), and the central bank has effectively declared the experiment a resounding success. I think it’s a bit premature to declare victory; after all, we’ve only watched the first half of the game. We are entering uncharted territory with the Fed now engaging in Quantitative Tightening (QT), the flip side of the policy that has been the modus operandi of central banks since the financial crisis.
What this means is that the Fed has become a net (although not an outright) seller of the $4.2 trillion in Treasuries and mortgage-backed securities it bought up over the last decade by letting them mature faster than it reinvests the proceeds. Starting at the trough of the market crash in early 2009, the various rounds of QE were put in place to boost financial asset prices. I have to believe QT could have the opposite effect.
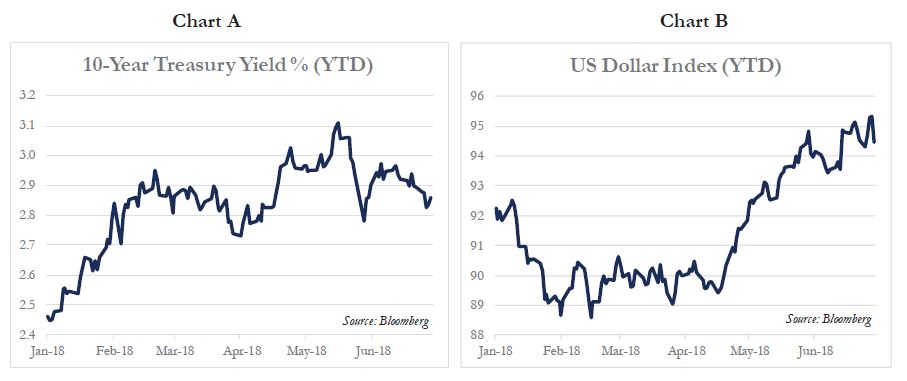
The U.S. is the first country to begin unwinding its extended easy money policies by raising interest rates and putting its central bank’s balance sheet on a diet. This major policy shift is already being reflected in the Treasury bond market, where risk-free rates have steadily increased since the beginning of the year (see chart (A) below), attracting foreign investors and causing the dollar to strengthen (see chart (B) below). As the world’s largest economy, financial tightening by the U.S. will have global ripple effects; as a source recently quoted by The Wall Street Journal put it, “The happy-go-lucky great synchronized recovery is coming to an end.”[1]
 In a preview of what can happen as capital moves around the globe at the speed of light, I present as Exhibit A the Italian government’s 2-year bonds (see chart (C) below). After trading at negative yields for the past year (a distortion of financial incentives I have talked about in past letters), the bonds’ yield spiked from 0.3% to 2.7% in the course of two days. This chart reflects to me how quickly financial markets can go from ignoring to punishing risk – in this case, the risk that Italy will elect a populist government that has promised further deficit spending and could potentially exit the Euro, leaving the highly indebted country’s creditors to be repaid in a new, less valuable currency.
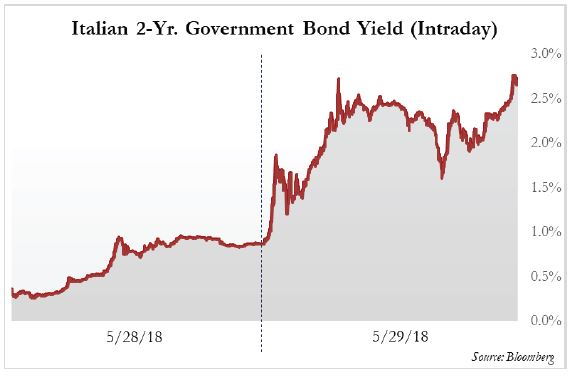
While we’re on the topic of improperly priced risks, another trend closer to home that I suspect won’t end well is the proliferation of corporate bond index funds and ETFs (Exchange-Traded Funds). Bond funds, especially passive ones, have driven much of the demand for new debt over the last decade. Federal Reserve data shows that mutual funds and ETFs have gone from owning just over 6% of the corporate bond market at the end of 2008 to almost 20% at the end of 2017. It’s no coincidence that over the same period, the mix of passive products has more than doubled to 20% of all taxable bond fund assets, according to Morningstar. Vanguard’s Total Bond Market Fund alone controls over $300 billion in assets, and it has another three bond funds worth north of $50 billion.
There are two problems with passive and marginally active funds driving an increasing share of bond buying. Like equity index funds, the underlying buyers are inherently price-insensitive. But unlike equity index funds, which are weighted by market cap and are thus skewed toward larger and ostensibly higher quality companies, bond indexes are weighted by the amount of debt issued. As a bond indexer, you’re lending the most money to the companies that issue the most debt, leaving the index skewed toward highly leveraged issuers.
This is exactly the opposite of what we are looking for in the fixed income portion of the Intrepid Balanced Portfolio (the “Portfolio”). We want to lend to issuers who are intent on repaying their debt using free cash flow generated by the business over as short a term as possible, not ones who continue to stack additional debt onto their capital structure. Consequently, we are holding much shorter-duration and higher quality debt than we have historically.
On the equity side, we also view our investments partly in terms of duration. A bond pays back its owner over a clearly defined period that ends when it matures. Stocks have no set expiration date, but the investor still expects to be paid back over a number of years as the company makes profits and generates cash. Hence, stocks are considered “long duration” assets because they have a long implied payback period.
Equity investors are also at the bottom of the food chain and get paid after literally every other layer of capital in a company’s balance sheet. Because stockholders have an inferior claim on the company’s profits and cash flows than bank creditors, bondholders, or preferred stockholders and have to wait longer to be paid back, we usually require a meaningfully higher return for being equity owners of a company than we do for lending money to the same company, which we have done before.
One metric that can be used as a proxy to compare the return equity investors require with the return on bonds is equity free cash flow yield, which measures cash generated by the business that is available to shareholders as a percentage of the company’s market value. A higher yield in theory translates to a higher expected return and shorter payback period. Until recently, the market has agreed with us that stocks deserve a higher implied yield than bonds. But what we’ve seen in the last several years is that free cash flow yields on large US companies, measured by the S&P 500, are no higher than the yields paid by much-safer investment grade BBB corporate bonds (see chart (D) below).
In short, stock investors are demanding barely any additional yield today for taking on the extra risk of being last in line to be paid back if financial conditions tighten significantly. I think this is indicative of the blasé approach to risk that has characterized the U.S. equity market for the last several years.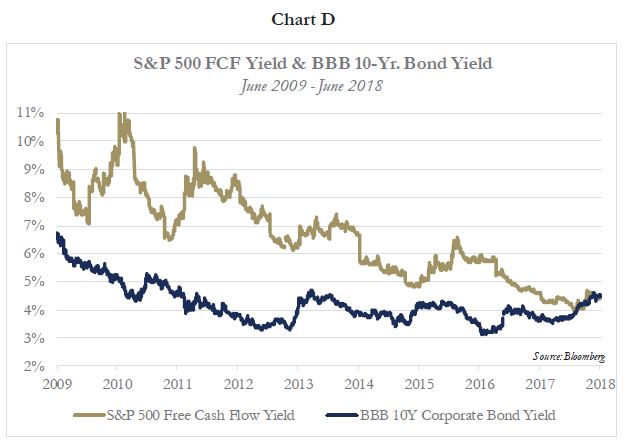
There is a common theme here which I learned at my father’s knee years ago when he said, “Son, it is very easy to borrow money, but it is very difficult to pay back.” Truer words have never been spoken. So, we are now in a world where $17 trillion worth of “free” money is being withdrawn from the financial markets with an unknown outcome. If the Fed continues to tighten and the dollar continues to get stronger, it will undoubtedly put stress on parts of the financial system that have been riding the tailwind of global easy money policies.
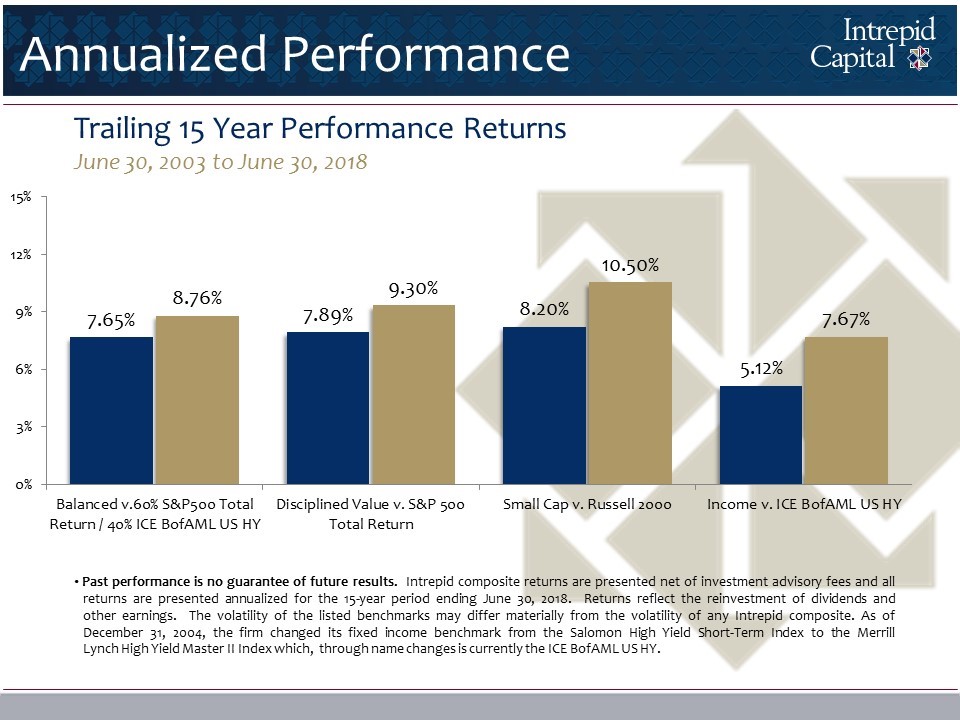
The Intrepid Balanced Portfolio increased 1.60%, net-of-fees, for the quarter ending June 30, 2018. In comparison, the ICE BofAML US Corporate Index decreased 0.94%, the ICE BofAML US High Yield Index increased 1.00%, and the S&P 500 Index increased 3.43%, for the same quarter. Year-to-date, the Portfolio has decreased 1.86%, net-of-fees, compared to the ICE BofAML US Corporate’s decline of 3.12%, the ICE BofAML US High Yield’s increase of 0.08%, and the S&P 500’s increase of 2.65%.
Please note that over half of the S&P 500’s year-to-date return is attributable to Amazon (ticker: AMZN) and Netflix (ticker: NFLX) – both companies with wonderful services, but wildly expensive valuations; and in Netflix’s case, a heavy debt load as discussed above. The other four constituents of the market darling FANGAM tech stocks – Microsoft, Apple, Facebook, and Google – make up the other half of the index’s 2018 return, meaning the other 499 companies in the index (yes, there are 505 companies in the S&P 500) are flat on average.
At Intrepid Capital, we continue to execute on our disciplined and risk-conscious investment process. In 20/20 hindsight, with the level of rate suppression activity both here and abroad, our defensive positioning over the last few years has been seemingly unnecessary. I suspect that attitudes toward risk control are starting to change as the macro wind is now in our face.
Both our preference for short duration in fixed income and our discounting of equity free cash flows should help us in a more volatile and difficult environment. I chuckled when I reread my letter from the end of the first quarter where I speculated, “Maybe this is a bell ringing at the top?” after a discussion with a polite 80-year old woman who told me I was too conservative. So far, the S&P 500 has yet to breach its late January high, when that discussion occurred.
The Portfolio’s largest contributors for the quarter ending June 30, 2018 were Jefferies Financial Group (formerly Leucadia National) (ticker: JEF), Greenhill & Co. (ticker: GHL), Discovery, Inc. (ticker: DISCK), Cheesecake Factory (ticker: CAKE), and Syntel (ticker: SYNT). Detractors for the quarter include Gattaca PLC (ticker: GATC LN), Biglari Holdings (ticker: BH), Western Digital (ticker: WDC), Berkshire Hathaway (ticker: BRK/B), and Royal Mail PLC (ticker: RMG LN).
Thank you for your continued support. I believe your patience will be rewarded as we continue to invest your capital and ours with a disciplined investment process.
All the best,

Mark F. Travis
President/CEO
[1] Mackinstosh, James. “Is the Dollar to Blame for the Global Market Malaise?.” The Wall Street Journal. 5 July 2018.