^Institutional Class shares of the Intrepid Income Fund commenced operations on August 16, 2010. Performance shown prior to August 16, 2010 (Since Inception) reflects the performance of Investor Class shares, which commenced operations on July 2, 2007, and includes expenses that are not applicable to and are higher than those of Institutional Class shares
Effective January 31, 2014, the Investor Class shares of the Fund were closed, and any outstanding Investor Class shares were converted into Institutional Class shares.
Performance data quoted represents past performance and does not guarantee future results.
Investment returns and principal value will fluctuate, and when sold, may be worth more or less than their original cost.
Performance current to the most recent month-end may be lower or higher than the performance quoted and can be obtained by calling 866-996-FUND. The Fund imposes a 2% redemption fee on shares held for 30 days or less. Performance data does not reflect the redemption fee. If it had, returns would be reduced.
Per the Prospectus dated January 31, 2025, the annual operating expense (gross) for the Intrepid Income Fund-Institutional Share Class is 1.01%. The Fund’s Advisor has contractually agreed to reduce its fees and/or reimburse expenses until January 31, 2025 such that total operating expense (net) for the Income Fund-Institutional Share Class is 1.00%. The Income Fund may have Net Expense higher than the expense cap as a result of any sales, distribution and other fees incurred under a plan adopted pursuant to Rule 12b-1 under the Investment Company Act of 1940, as amended (the “Investment Company Act”), acquired fund fees and expenses or other expenses (such as taxes, interest, brokerage commissions and extraordinary items) that are excluded from the calculation. As a result of the calculations, the Net Expense for the Income Fund-Institutional Class is 1.00%. The Net Expense Ratio represents the percentage paid by investors. Otherwise, performance shown would have been lower.
30-Day Subsidized SEC Yield: 6.85%; 30-Day Unsubsidized SEC Yield: 6.82%
October 4, 2025
Dear Fellow Shareholders,
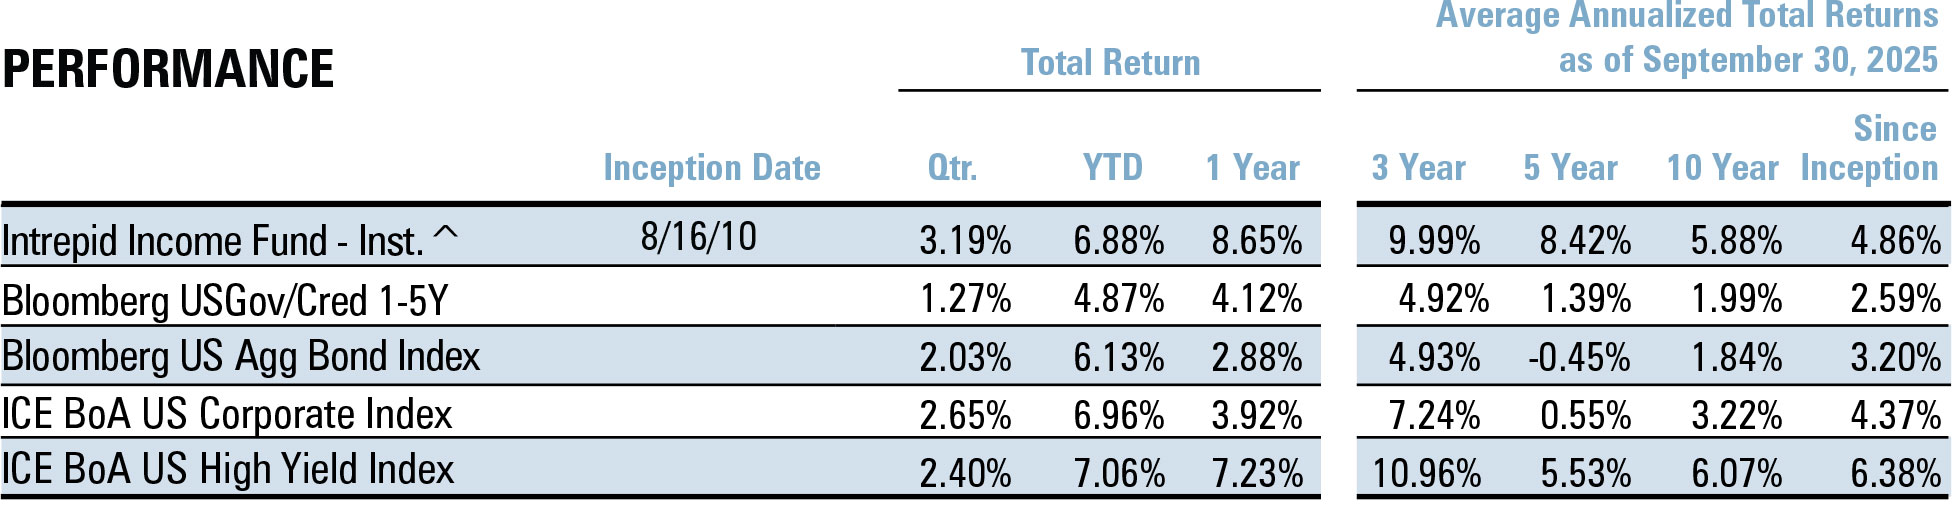
Markets continued their post-Liberation Day momentum with a stellar third quarter. Major equity indices were up 8-12% and closed just shy of all-time highs. Across fixed income, the Fund’s benchmark Bloomberg 1-5 Yr US Gov/Credit Index returned 1.27%, the Bloomberg US Aggregate Bond Index returned 2.03%, the ICE BofA US Corporate Index returned 2.65% and the ICE BofA High Yield Index (“the High Yield Index”) returned 2.40%.
We are pleased to share that the Intrepid Income Fund (“the Fund”) returned 3.19% for the quarter ended September 30, 2025. For the Fund’s fiscal year ending September 30th, the Fund returned 8.65%, compared to 4.12% for the Fund’s benchmark.
The relentless march higher of high yield bonds is worth noting. If the High Yield Index were to remain flat for Q4 2025, it would cap off the best 3-year run for that index since 2011-2013 at ~9.5% annualized. In the process, spreads compressed by ~180 basis points, ending the quarter near multiyear lows at approximately 300 bps. The new issue market accelerated as well. The 118 new issues in Q3 were the highest of any quarter since 2021 and included an uptick in deals we judged as more speculative. In short, risk appetite has come roaring back since the volatility in April.
The credit market’s frothy trading over this period has ignored what appear to be growing signs of an economic slowdown. Broad macro indicators such as new construction activity, freight volumes, and the labor market each experienced gradual deterioration. Certain pockets of consumer spending also started to show signs of weakness. More visceral examples included the recent bankruptcy of subprime auto lender Tricolor and the collapse of auto supplier First Brands Group.
Our view is more mixed. While we are monitoring key economic data closely, the performance of the businesses we follow has generally remained favorable. We could say the same about the tone of the frequent discussions with management teams that we have quarterly. This, of course, varies by sector and individual company, which is a key reason our investment process permits flexible sector exposure and allows us to take more concentrated positions in businesses that are better positioned to withstand further weakness.
In the event of a further slowdown, the impact on corporate bond prices seems less certain to us. Credit spreads probably widen, but this is likely to be offset at least partially by rate cuts. To that end, the Fed cut rates 25 basis points in September while market implied odds anticipate another two cuts for the balance of the year. Short-term treasury yields ended the quarter near their lows for calendar 2025. Should business performance remain resilient against a gradually slowing backdrop, it could set the stage for another period of strong performance for high yield bonds. Especially considering many issuers capitalized on the active refinancing window by extending maturities at favorable rates, providing flexibility to endure through a more challenging period.
As usual, we lack strong conviction on the direction of the macro economy but maintain high conviction in the credit quality of the few dozen businesses that the Fund holds. If spreads continue to remain extremely tight and/or rates reduce further, we expect to moderately reduce risk in the portfolio. In such case, it would be reasonable to expect us to slightly underperform the High Yield Index if it continues to pace at a similar rate of return as in the previous 2-3 years. Conversely, we would expect to improve downside protection and capital preservation in the event of a more systemic, adverse credit environment.
Our stated goal in this higher-rate environment has been to deliver equity-like returns with lower volatility. Because of our continued effort to provide downside protection, we have occasionally shared that we would typically not expect to keep up with the High Yield Index during a period of market exuberance. In light of our outperformance during this “frothy” quarter, we thought a further discussion would be helpful.
Put simply, we constantly assess the level of credit risk we take in the Fund and are especially guarded against applying a more risk-on posture in markets like the current one. Thus, we are confident that this quarter’s strong performance was driven by a combination of idiosyncratic events in specific bonds as well as the outperformance of some positions that lagged during Q2.
To support this point, the top three contributors during Q3 added just over 80 basis points to the Fund’s performance during the third quarter. On the downside, the top three detractors amounted to a 10 basis points headwind. We normally expect a healthy amount of variance versus our comparative indices given our high active share and more concentrated positioning. But it would be fair to say that the alpha generated this quarter came from a handful of positions. We attribute this to a mix of good credit picking and some good luck rather than riskier, beta-driven positioning.
Looking forward, we will continue to focus on identifying opportunities in our core niche of small issue, off-the-run fixed income securities. If there is anything we can do to serve you better, please give us a call. Thank you for your trust and investment.
Sincerely,

Hunter Hayes, CFA, Chief Investment Officer
Intrepid Income Fund Co-Portfolio Manager

Mark F. Travis, President
Intrepid Income Fund Co-Portfolio Manager

Matt Parker, CFA, CPA
Intrepid Endurance Fund Co-Portfolio Manager

Joe Van Cavage, CFA
Intrepid Endurance Fund Co-Portfolio Manager