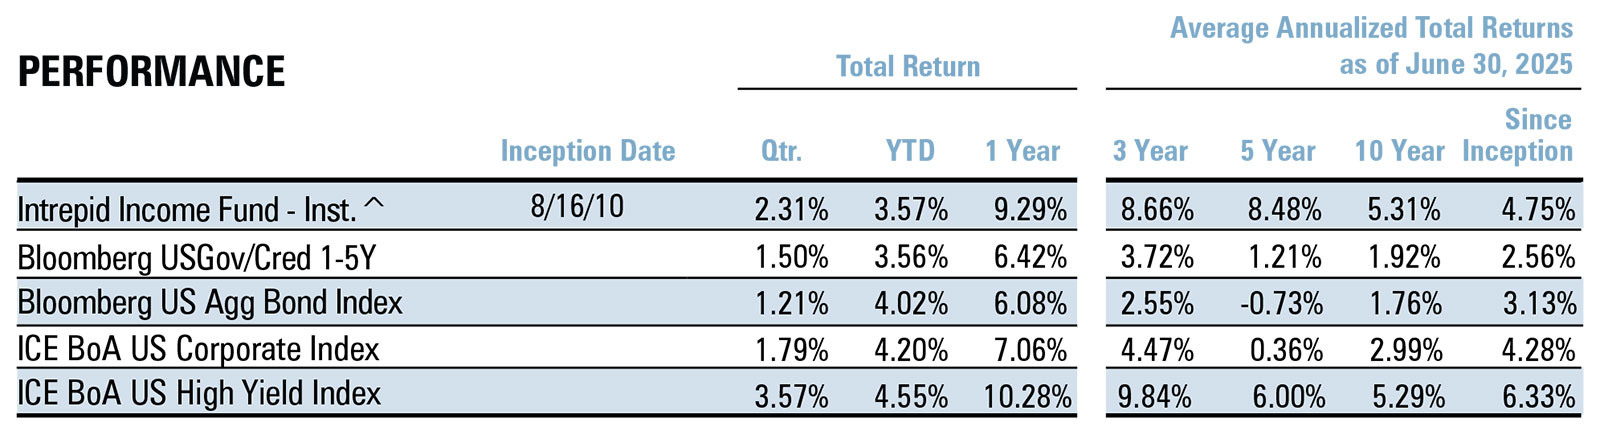
^Institutional Class shares of the Intrepid Income Fund commenced operations on August 16, 2010. Performance shown prior to August 16, 2010 (Since Inception) reflects the performance of Investor Class shares, which commenced operations on July 2, 2007, and includes expenses that are not applicable to and are higher than those of Institutional Class shares. Effective January 31, 2014, the Investor Class shares of the Fund were closed, and any outstanding Investor Class shares were converted into Institutional Class shares.
Performance data quoted represents past performance and does not guarantee future results.
Investment returns and principal value will fluctuate, and when sold, may be worth more or less than their original cost. Performance current to the most recent month-end may be lower or higher than the performance quoted and can be obtained by calling 866-996-FUND. The Fund imposes a 2% redemption fee on shares held for 30 days or less. Performance data does not reflect the redemption fee. If it had, returns would be reduced.
Per the Prospectus dated January 31, 2025, the annual operating expense (gross) for the Intrepid Income Fund-Institutional Share Class is 1.04%. The Fund’s Advisor has contractually agreed to reduce its fees and/or reimburse expenses until January 31, 2025 such that total operating expense (net) for the Income Fund-Institutional Share Class is 1.01%. The Income Fund may have Net Expense higher than the expense cap as a result of any sales, distribution and other fees incurred under a plan adopted pursuant to Rule 12b-1 under the Investment Company Act of 1940, as amended (the “Investment Company Act”), acquired fund fees and expenses or other expenses (such as taxes, interest, brokerage commissions and extraordinary items) that are excluded from the calculation. As a result of the calculations, the Net Expense for the Income Fund-Institutional Class is 1.01%. The Net Expense Ratio represents the percentage paid by investors. Otherwise, performance shown would have been lower.
30-Day Subsidized SEC Yield: 7.82%; 30-Day Unsubsidized SEC Yield: 7.82%
June 30, 2025
Dear Fellow Shareholders,
It was quite a quarter for fixed income and for capital markets broadly. Not because credit returns were remarkable in isolation, but because of the backdrop in which they occurred.
As we noted in our Q1 2025 commentary, that quarter felt like the calm before the storm. The storm arrived in early April, when the U.S. enacted sweeping, reciprocal tariffs on key trade partners following Liberation Day. The reaction was swift: equity indices sold off sharply, capital markets seized, and risk appetite evaporated.
Against that context, the resilience of fixed income markets was striking. The Bloomberg 1–5 Yr U.S. Gov/Credit Index returned 1.50%, the Bloomberg U.S. Aggregate Bond Index gained 1.21%, the ICE BoA U.S. Corporate Index returned 1.79%, and the ICE BofA U.S. High Yield Index posted a strong 3.57%. The Intrepid Income Fund (the “Fund”) returned 2.31% in Q2.
How did credit markets deliver positive returns after such a turbulent start? The shift began in late April, when the U.S. paused the new tariffs for 90 days to allow for bilateral negotiations. This de-escalation was followed by carveouts, country-specific exemptions, and early trade wins that helped sentiment recover sharply.
If Q1 was the calm before the storm, Q2 was a tale of two markets: a violent risk-off period in early April followed by a sharp rally. By quarterend, credit markets were wide open, new issuance was robust, and high yield spreads finished tighter than they were before Liberation Day.
Stepping back to assess the first half of 2025, high yield’s resilience stands out. In April’s depths, the ICE BofA U.S. High Yield Index was down just

under 2% year-to-date – remarkable when compared to large-cap equities
(as represented by the S&P 500 Index, down 15%) and small caps (as represented by the Russell 2000 Index, down over 20%) at their lows. Peak-to-trough comparisons similarly favored credit.
This performance supports a thesis we’ve held for some time: that today’s high yield market, with a greater share of BB-rated and secured bonds, is both higher quality and lower duration than in previous cycles. That played out in April. Even as credit spreads widened, they never breached long-term averages, suggesting markets were stressed but not panicked.
To wit, for the first half of 2025, the ICE BofA U.S. High Yield Index returned 4.55%, roughly in line with equities (S&P 500 Index = 6.20%; Russell 2000 Index = -1.79%), but with considerably less drawdown and volatility.
The Fund returned 2.31% in Q2 and 3.57% for the first half of 2025. As noted last quarter, the initial Liberation Day tariffs led us to re-underwrite the entire portfolio and swiftly exit positions with direct exposure and limited visibility under the new regime. In hindsight, we reduced credit risk more aggressively than necessary. But given the ongoing uncertainty, we are comfortable maintaining higher liquidity and lower credit risk than pre-April levels.
As we write this, the 90-day tariff pause is nearing expiration. We are not in the business of forecasting geopolitics or market outcomes. But with a current yield-to-worst of 8.2% and effective duration of 2.3 years, the Fund is positioned to deliver attractive risk-adjusted returns without needing further improvement in macro sentiment. If credit markets continue to rally, we are more likely to reduce risk than chase returns.
Looking forward, much attention is now focused on the path of interest rates. For the first time, the President has publicly signaled plans to replace the Federal Reserve Chair in 2026 with someone committed to an aggressive ratecutting cycle. This has created uncertainty across the Treasury curve. Will short rates pull long rates lower, or will concerns over Fed independence drive long-end yields higher?
As we’ve said before, predicting market outcomes is a difficult and often futile exercise. Our own comments in the Q1 2025 commentary, warning of higher volatility and rising risk premiums, seem prudish just 90 days later as the risk indices approach all-time highs.
Fortunately, our process does not depend on market timing. We remain focused on our niche; small-cap credits with short duration, vigilant credit underwriting, and an emphasis on capital preservation. Let others wager on policy shifts. Our job is to deliver equity-like returns with lower volatility, backed by seniority in the capital structure.
With 1-, 3-, and 5-year compound annual returns all in the 8.5% to 9.5% range, we believe the Fund has lived up to that mandate.
Thank you for your trust and investment. If there is anything you would like to discuss, please do not hesitate to reach out.
Sincerely,

Hunter Hayes
Intrepid Income Fund Co-Portfolio Manager

Mark F. Travis, President
Intrepid Income Fund Co-Portfolio Manager

Matt Parker, CFA, CPA
Intrepid Endurance Fund Co-Portfolio Manager

Joe Van Cavage, CFA
Intrepid Endurance Fund Co-Portfolio Manager