“It was the best of times, it was the worst of times.”
— Charles Dickens, A Tale of Two Cities
July 31, 2026
Dear Fellow Shareholders,
Is the high yield credit market historically expensive? Or is it fundamentally in the best shape of its existence? We believe the answer to both questions is “yes.”
The second quarter offered a tale of two markets. One was characterized by resilient corporate fundamentals, very little distress, an orderly extension of near-dated maturities, and attractive all-in yields with improving lender protections. The other featured historically tight credit spreads, elevated risk-asset valuations on the equity side, and plenty of unnerving headlines about the state of the consumer, our ballooning national debt, and broader geopolitics.
We continue to believe there are attractive opportunities to deploy capital into the liquid, sub-investment-grade universe, but we remain on high alert given pricing and macroeconomic constraints. We believe our short duration positioning will allow us to take advantage of dislocations as they arise, but we also feel like this is among the most attractive high yield markets that we have seen.
The Best of Times
As Barclays wrote in a recent piece1 on the strength of U.S. high yield, “the index is near its highest quality on record, with 55% of par rated BB.” They went on to assert, “expected credit losses still remain near record lows based on the quality and security composition of the high yield index today.” Across the board, we agree with Barclays and contend that fundamental measures of credit health like leverage multiples, interest coverage, and debt-to-enterprise-value look incredibly robust.
Nonetheless, the option-adjusted spread (OAS) for the Bloomberg U.S. Corporate High Yield Index (the “High Yield Index”) ended the 2nd quarter at 270 bps, close to its lowest on record, which equates to a yield-to-worst of 7.16%. We believe that with some of the convexity built into the index, which had an average-weighted dollar price of $97.11 at quarter-end, the forward total returns could be more like 8-9% as companies look to retire debt before maturity.
 Considering the High Yield Index also has an effective duration of 2.92 years, close to its lowest on record, this is also a corner of credit that is less sensitive to the vicissitudes of interest rates. Furthermore, we believe that the High Yield Index has significantly less exposure to expensive, potentially overvalued asset classes, like technology (~6.7% of the index at quarter-end), relative to previous cycles when it had significant concentration in overvalued sectors like Communications (~35.7% in 2000) and energy (~17.0% in 2015). Much of the debt funding for today’s hotter sectors has come from private credit.
In our view, this adds up to an asset class with high current yield, an equity-like total return profile, low duration risk, and the best cohort of underlying issuers in a long while.
The Worst of Times
“Safer” debt continues to get eviscerated, with the Bloomberg U.S. Aggregate Bond Index (the “Aggregate Index”) down 69 bps through the end of July and the long end of the treasury curve careening to a level it has not seen since before the Great Financial Crisis in 2007. If you had purchased the Aggregate Index six years ago at the end of July 2026, you would have lost nearly 3% of your initial investment even after accounting for all the interest. This is almost entirely because of the pernicious effect of rising interest rates on an asset class laden with duration risk.
Many clients ask us what we think interest rates will do, and we always tell them, honestly, that we have no idea. However, we do feel like there will continue to be volatility as the market works to discover what lenders need to be paid for our ever-growing debt pile.
As we wrote about last quarter, we continue to closely monitor the private credit market which we believe is exhibiting some worrying characteristics.
Redemption requests in “semi-liquid” private credit vehicles continued to be elevated during the second quarter, with several high-profile funds receiving repurchase requests well in excess of their gating requirements. Although redemption pressure does not necessarily indicate immediate deterioration in the underlying loans, it exposes the fundamental tension between offering periodic liquidity to investors and holding assets that may require years to monetize. In our corner of the liquid credit market, we have even seen some private credit loans repackaged as broadly syndicated loans to help create liquidity with mixed success.
Fitch’s U.S. private-credit default rate reached 6.0% for the trailing 12 months through May, the highest level since Fitch began tracking the market, compared with 4.6% one year earlier2. More than half of the defaults through April involved interest-payment deferrals or the introduction of payment-in-kind interest rather than a straightforward missed payment. We have started using a different acronym for payment-in-kind, or PIK. We prefer principal-on-outstanding-principal, or POOP. The higher default rates and proliferation of POOP are worth keeping an eye on.
Lastly, we believe public-equity valuations continue to price in perfection with the cyclically adjusted P/E ratio (the “CAPE” ratio) for the S&P 500 reaching approximately 40.9x at quarter end3, approaching extreme levels last observed near the peak of the technology bubble. We realize that CAPE is an imperfect metric, but we would still contend that, by almost any measure, we are in a historically expensive equity market.
Historically, equity downside and high yield downside have tended to correlate, but we believe that high yield could have considerably less downside capture vs. the S&P 500 going forward owing to the fundamental strength of the index and the relatively low exposure to the most expensive parts of the market.
The Opportunity
We continue to believe the case for high yield credit remains the most compelling on a risk/return spectrum across the liquid credit world. We cannot recall an environment rifer with opportunities for equity-like returns with solid underlying businesses and robust lender protections than today, especially amongst the smaller issue sizes and non-rated issuers we like to focus on at Intrepid.
We are often asked whether we will look to extend duration as the curve continues to float higher and investment-grade yields start to look more compelling. We view duration risk as just as much a fundamental credit risk as it is an interest rate risk. We still do not believe that, in most cases, we are being compensated enough to extend the length of time we lend companies money for the extra return we are receiving. However, that can change as the curve continues to adjust for what we view is a long overdue recognition of the risks.
In one recent, high-profile example of the market repricing “creditworthy” duration risk, BBB+ rated SpaceX bonds due in 2056 traded down over 10 points from their pricing and ended July 2026 at a yield of 7.87% – more than the High Yield Index!
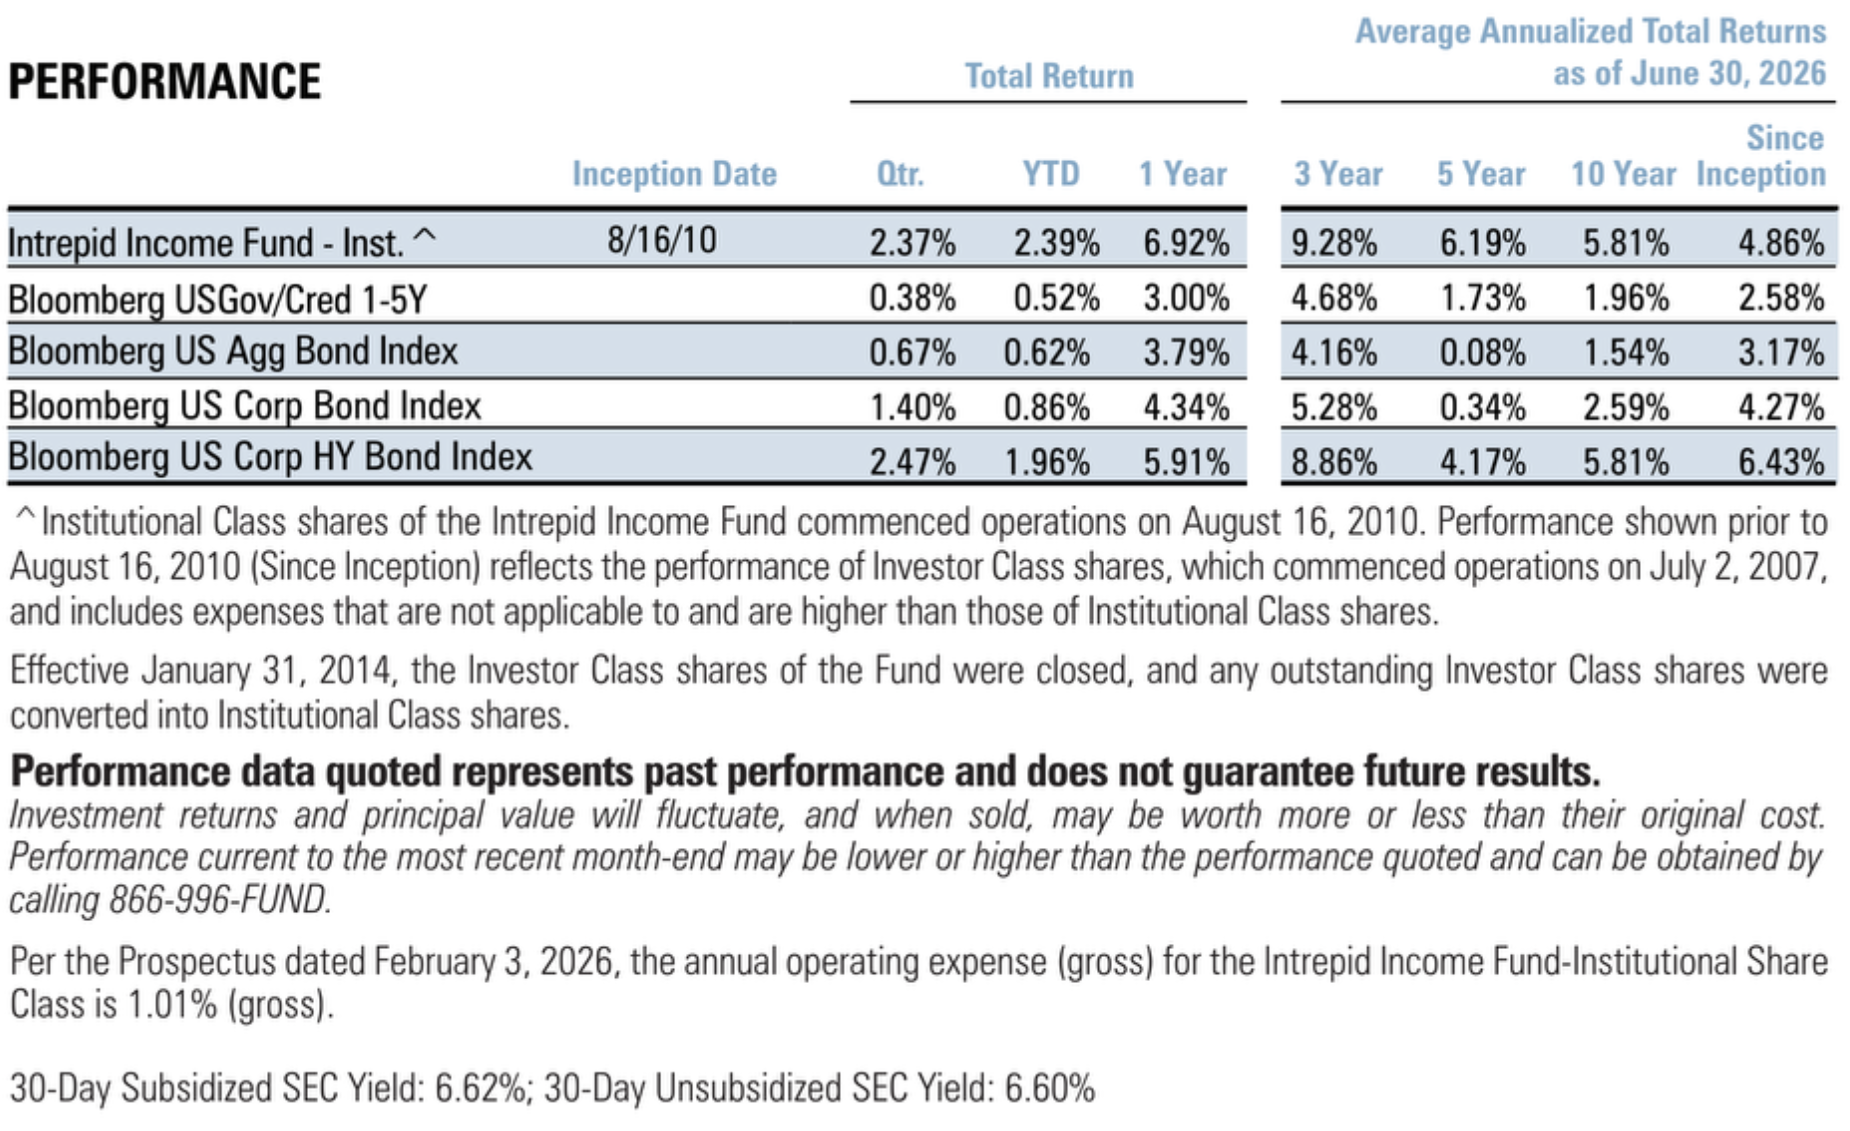
The Intrepid Income Fund (“the Fund”) returned 2.37% during the quarter. Over the same period, the Fund’s benchmark Bloomberg U.S. 1-5 Year Government/Credit Bond Index returned 0.38%, the Bloomberg U.S. Corporate High Yield Index returned 2.47%, and the Bloomberg U.S. Aggregate Bond Index gained 0.67%. We ended June with an effective duration of 1.55 years and a yield-to-worst of 7.87%.
In summary, high yield’s fundamentals justify confidence, but its valuation demands selectivity. We remain bullish on credit, but not indiscriminately so. At nearly an 8% portfolio yield, with limited duration and solid lender protections, we believe the Fund can continue pursuing equity-like return potential while assuming materially less volatility and downside risk than equities.
Our task as credit investors is not to predict exactly what will happen but to be prepared for worst-case outcomes. We believe that today’s portfolio is receiving adequate compensation for the myriad risks that do exist and that our positioning gives us the flexibility to take advantage of any opportunities that arise from inevitable dislocations.
2 https://www.fitchratings.com/research/corporate-finance/fitch-ratings-us-private-credit-default-rate-remains-at-record-high-6-0-in-may-2026-15-06-2026
3 https://ycharts.com/indicators/cyclically_adjusted_pe_ratio?
Thank you for your trust and investment. If there is anything we can do to serve you better, please do not hesitate to reach out.

Hunter Hayes, CFA, Chief Investment Officer
Intrepid Income Fund Co-Portfolio Manager

Mark F. Travis, President
Intrepid Income Fund Co-Portfolio Manager

Matt Parker, CFA, CPA
Intrepid Endurance Fund Co-Portfolio Manager

Joe Van Cavage, CFA
Intrepid Endurance Fund Co-Portfolio Manager