Performance
Performance data quoted represents past performance and does not guarantee future results. Investment returns and principal value will fluctuate, and when sold, may be worth more or less their original cost. Performance current to the most recent month-end may be lower or higher than the performance quoted and can be obtained by calling 866-996-FUND. The Funds impose a 2% redemption fee on shares held for 30 days or less. Performance data does not reflect the redemption fee. If it had, returns would be reduced.
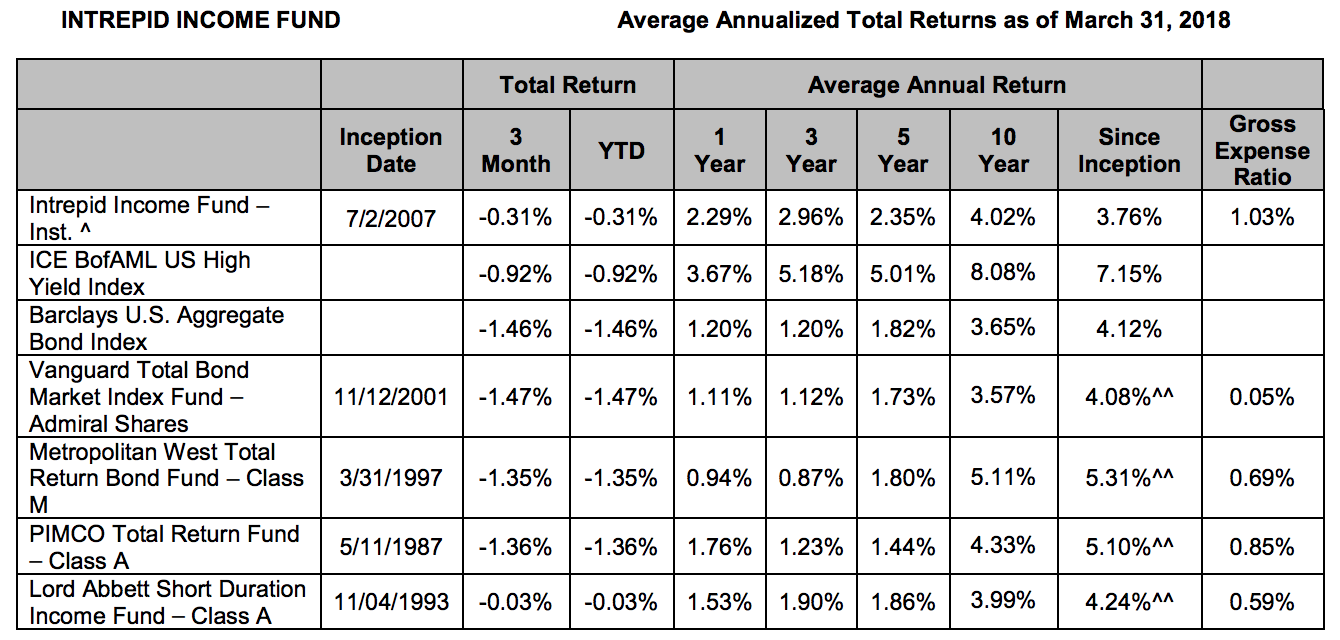
Institutional Class shares of the Intrepid Income Fund commenced operations on August 16, 2010. Performance shown prior to August 16, 2010 (Since Inception) reflects the performance of Investor Class shares, which commenced operations on July 2, 2007, and includes expenses that are not applicable to and are higher than those of Institutional Class shares.
^^Since Inception returns are as of the Intrepid Income Fund’s Investor Class inception date (7/2/07). The annualized since inception return for the Vanguard Total Bond Market Index Fund – Admiral Shares (VBTLX – 11/12/01) is 4.04%, for the Metropolitan West Total Return Bond Fund – Class M (MWTRX – 3/31/97) is 6.11%, for the PIMCO Total Return Fund – Class A (PTTAX – 5/11/87) is 6.74%, and the Lord Abbott Short Duration Income Fund – Class A (LALDX – 11/04/93) is 4.16%.
Effective January 31, 2014, the Intrepid Income Fund – Investor Class shares were closed, and any outstanding Investor Class shares were converted into Institutional Class shares.
Performance data quoted represents past performance. Past performance does not guarantee future results. Investment returns and principal value will fluctuate, and when sold, may be worth more or less their original cost. Performance current to the most recent month-end may be lower or higher than the performance quoted and can be obtained by calling 866-996-FUND. The Funds impose a 2% redemption fee on shares held for 30 days or less. Performance data does not reflect the redemption fee. If it had, returns would be reduced.
Transcript
Mark Travis:
Welcome to the Intrepid Capital Funds’ first quarter manager update. We’re going to run through a few disclosures before we get started. Thank you.
Hello, everyone. This is Mark Travis, president of Intrepid Capital Funds. Welcome to the first quarter 2018 semi-annual webinar for our funds. I’d like to welcome some new speakers from our group today – Hunter Hayes, Matt Parker, and Clay Kirkland. They’ve got a few topics to discuss with you as fund shareholders, which I think you’ll find of interest. With that I’m going to pass the mike over to Hunter Hayes.
Hunter Hayes:
Thanks, Mark. With that, I want to discuss an important topic – interest rates. In the wake of the Great Recession almost a decade ago, rates were propped lower by the Federal Reserve through lots of open market purchases and lots of money printing, a process dubbed quantitative easing. Lower rates helped incentivize borrowing and growth, but at a cost. After all, the Fed can’t print money forever to keep rates low. To that end, the Fed started to gradually raise interest rates a couple years ago. Although we don’t take a view here at Intrepid on what exactly the Fed will decide to do, we do consider the impact these rate hikes could have on markets.
The Federal Reserve controls interest rates by changing their target for the Federal Funds Rate. As you can see from the Fed’s dot plot, the direction for rates is trending upward, and that means we should expect to see rising rates, although how steep or how quickly they will rise is anyone’s guess. Many of you have probably heard about the Federal Reserve’s dual mandate – to keep inflation at a healthy level and to keep unemployment low. The Fed Funds Rate is one of the main levers the Fed controls to achieve that dual mandate.
Given some of the positive economic data that’s been coming out recently, like low unemployment, decent wage growth, and inflation around the Fed’s two percent target, the Fed’s indicated that now is a good time to raise rates. The Fed Funds Rate affects everything. Mechanically, this is the rate at which banks lend reserve balances to other banks on an overnight basis. The Fed uses the rate to control supply and influence inflation. In turn, government debt is highly correlated with the Fed Funds Rate.
Since treasuries are often used as a proxy for the risk-free rate, higher rates mean discount rates for securities tend to go up, which drives the intrinsic value of those securities down. Additionally, since corporate bonds and other securities often trade at a spread to these risk-free government bonds, they’re also affected.
For a more tangible example of how rising interest rates will affect securities, let’s look at small cap stocks. Over the past five years, small caps in the Russell 2000 have nearly doubled their overall net debt, according to data from Bloomberg. 42 percent of the debt owned by companies in the Russell 2000 carries floating interest rates, compared to just nine percent in the S&P 500.
Floating rate debt means the cost of debt on these instruments is tied to a benchmark, like the US Treasury rate, LIBOR, or the Fed Funds Rate. Such a high percentage of floating rate debt leaves these small caps vulnerable to a rise in interest rates and/or inflation. Furthermore, small caps currently spend a third of their operating income, or EBIT, on interest payments. This interest payment burden will only become more pronounced as rates continue to go up. In order to explain why, let me give an example with a super regular, super boring fictional company.
Let’s call it the Boring Company. Seems like that one’s already taken. Okay. How about ABC Incorporated? Let’s assume ABC makes $10 million in revenue a year, $2 million of EBIT, and $1 million of levered free cash flow. ABC’s market cap in this example is $30 million, so it currently trades at 30 times free cash flow. Although that might sound expensive, it’s much cheaper than the average free cash flow multiple small caps in the Russell 2000 currently trade it.
Now let’s further assume that ABC has a debt load of $15 million, for which it pays an average interest rate of 4.4 percent, which comes out to about $0.66 million a year. That interest burden is a third of ABC’s EBIT, which, as I discussed earlier, makes it average for the Russell 2000 small cap. What would happen if ABC’s cost of debt went up by one percent?
So, if ABC’s cost of borrowing went up one percent, it would pay an extra $0.15 million a year in interest payments, and its free cash flow would decrease accordingly. For those of you astute enough to notice that $1 million minus $0.15 million isn’t $0.88 million, there’s also a slight adjustment for the tax benefit from the increase in interest payments, which makes up the difference. ABC’s levered free cash flow shrinks over 10 percent for every one percent rise in its cost of debt.
Next comes an important question. What happens to ABC’s stock price when free cash flow lowers because of higher interest costs? There are really two possibilities. Holding all else equal, either the market cap, and therefore the stock price, can stay at the same level, which will be driven by multiple expansion, or the multiple could stay the same, implying a fall in the market cap.
So let’s go with the first scenario, where the market cap stays the same. If the market cap stayed the same following a rise in ABC’s cost of debt, the free cash flow multiple would go up by four turns. Bear in mind that multiples are cyclical and already look extended to us here at Intrepid. Hoping that multiples will continue to stretch higher in the face of lower cash generation is not something we like to do.
Then there’s the second scenario, where multiples stay the same. In this scenario, market cap is the variable that must change to make the equation work. In ABC’s case, $3.5 million of market cap needs to be erased for the company to continue trading at 30 times free cash flow, which equates to 12 percent of its old market cap. And that’s just from a one percent increase in ABC’s cost of debt. To reiterate, in order for companies with a debt profile like ABC’s to continue trading at the same multiple, following a one percent increase in the cost of debt, they would have to erase over 10 percent of their market cap.
Another thing to consider is how long it’ll take for the change in the cost of debt to affect the free cash flow for ABC. If most of ABC’s debt was fixed rate debt, the actual impact of higher rates would not be felt until ABC had to refinance. However, given that 42 percent of outstanding debt at small cap companies is floating rate, your typical small cap company, like ABC, likely has some exposure to variable debt. Therefore, ABC would feel an immediate impact from rate increases.
The ABC company illustrates how big of an impact leverage can have in a rising rate environment. That is one of the reasons Intrepid looks for quality businesses without a large leverage burden that will cost more to service in the future. We realize that low rates can’t last forever, and eventually businesses will pay a cost of debt that reflects their creditworthiness. Now I’m going to hand things off to Matt Parker to dig a little deeper into some of the second order effects that rising rates will have on markets.
Matt Parker:
So as Hunter discussed, interest rates clearly have a significant impact on the debt burden and equity valuations for companies. I’d like to talk about some of the secondary effects of rising rates. For instance, pensions, insurance companies, and other institutional asset managers are likely to adjust asset allocations as bonds become more attractive relative to stocks. Another example is an increase in the fiscal deficit due to a higher interest burden. There will also likely be changes in investor sentiment – for example, stocks in sectors like utilities, REITs, and MLPs tended to trade as proxies for bonds. As rates increase, these sectors may be disproportionately affected.
And finally, we’ve listed volatility and inflation as the two topics we’d like to drill down on in further detail. Now, to be clear, inflation is typically thought of as a cause, not an effect, of rising rates. But the linkage of the two is important, and we believe it’s an interesting topic to discuss.
I’m going to start with volatility. So on this chart, we’ve included a graph of the average VIX level over the previous year, and plotted this going back to 2000. We’ve also included the average VIX level over the entire period. And we can clearly see that the past five or so years have been pretty quiet relative to historical averages. We believe that low rates and quantitative easing have been an important reason for this muted volatility.
Central banks have pumped excess liquidity into the financial system, which has eased market conditions. Additionally, the low rates have led to yield chasing strategies that rewarded buying risk assets if prices fell even slightly. And finally, many market participants have anticipated that accommodative central banks would step in if prices fell too far. Many refer to this as the Greenspan or Bernanke or Yellen put. And the market’s dependence on these favorable conditions over the past several years reminds us of some… other dependencies.
These market conditions led to the rise of several strategies that are designed to perform well in a low volatility environment. The most straightforward strategy was to sell volatility derivatives, or buy inverse derivatives linked to volatility. Much larger, however, are strategies that are implicitly linked to volatility. This includes strategies such as risk parity, value at risk, and other volatility targeted trading strategies.
What’s interesting is how broad the investor base is that has used these strategies. It wasn’t just retail investors who were selling volatility while day trading. There were also state pensions, university endowments, and sophisticated hedge funds making these types of trades. The size of these strategies is also significant. While volatility linked derivatives, such as the VXX or XIV, are a small component of the market, the strategies that are implicitly short volatility are much larger. Some estimates peg the size of short-vol strategies as high as $1.5 trillion of invested assets. So clearly a meaningful size.
If we do start to see more volatility from higher rates, what does this mean for the market? An obvious result is that we should generally see more variation in prices across asset classes. And with that variation, there could be more shifts and rebalancing in asset allocations. It’s also possible that periods of elevated volatility could create dangerous feedback loops. As I mentioned earlier, we believe low rates have encouraged higher leverage and more buying of risk assets, which helps create low volatility.
The unwind of this same process could become problematic for asset prices. For instance, a period of higher volatility would result in higher risk metrics for strategies linked to volatility. As these strategies de-risk and sell assets, it could in turn create even more volatility. We got a small taste of the potential effects of heightened volatility last month, when there was a sudden spike in the VIX. Up until that time, certain investments that inversely tracked the VIX had become increasingly popular.
A good example was an exchange traded note, or ETN, with the ticker XIV. This investment provided a cash payment based on the inverse performance of the VIX. Investors were undoubtedly attracted to the outstanding performance of this security in 2017. However, when the VIX rose over 100 percent on February 5, it effectively wiped out products such as the XIV in a single day, and helped trigger a broader selloff in the equity market.
At Intrepid, we welcome volatility. Our decisions to buy and sell securities are based entirely on our estimates of intrinsic value. Our valuations are not impacted by any factors linked to price movements. We don’t use technical analysis, and our risk estimates do not consider a stock’s beta. Because our valuations are unaffected by price movements, we view greater volatility as a greater opportunity to be presented with a good deal.In addition, our portfolio management strategy does not employ any volatility targets, so we won’t change the overall allocation of a fund due to changes in volatility.
To introduce the topic of inflation, I want to pose a question we’ve heard some in the investment community ask. That is – if interest rates are going up because of the strong fundamental growth of the economy, why is this bad for stocks?
To answer this, we can dissect the interest rate into three components. First, there’s the real risk-free rate, which is correlated to GDP growth. The other two factors are inflation and any risk premiums assigned to the borrower. How can we tell if recent increases in rates are coming from improving growth fundamentals, which isn’t necessarily a negative for stocks, or from inflation, which is generally problematic for stocks?
On this chart, we plotted the spread between a generic US Treasury bond, and an inflation protected Treasury bond, or TIP. We’ve done this for the 10-year and 30-year bonds, beginning when rates fell to their most recent low in early September 2017. If inflation expectations remain constant, we would expect the spread between these bonds to stay roughly the same. That’s clearly not the case, however, as spreads began to move higher in late 2017. Thus, expectations of higher inflation have clearly been an important driver behind the recent move higher in rates.
We’ve been starting to see more and more signs of inflation in the businesses that we follow. Companies are increasing wages, and the labor market has tightened as unemployment has fallen to multiyear lows. Commodity prices have also increased, and we’ve noticed management teams increasingly mentioning rising input costs in earnings reports.
So how do financial assets fare in an inflationary environment? While inflation is sometimes thought of as a danger for bonds, it’s generally a problem for stocks, too. But some companies are able to weather inflation better than others. The relative losers are generally companies operating in highly competitive industries that are unable to pass cost increases along to their customers. Companies that earn low returns on capital also tend to fare worse, as the reinvestment into higher-priced operating assets consumes a larger portion of cash flows. By contrast, the relative winners are high return on capital businesses with strong pricing power.
At Intrepid, we seek out companies with competitive advantages that lead to pricing power. When we search for new investments, we typically look for companies with strong returns on capital that can indicate high barriers to entry or other important competitive advantages that create pricing power.
In addition, a business earning a high return on its capital does not need to reinvest as much of its cash flow into assets that are now more expensive in order to grow. Here we’ve included logos from a few of our holdings that we believe are better suited than most businesses to deal with inflation. And with that, I’d like to turn it over to Clay to discuss our portfolio approach in more detail.
Clay Kirkland:
As Matt discussed, interest rates play an important role in more than just the bond market. Changes in interest rates can affect almost every class, whether it’s directly or indirectly. I’m going to discuss the impact of rising rates on equity valuation using traditional finance, and touch on why it’s less of an issue with how we value stocks. Then I’ll talk about how we think about bonds and discuss why we believe our current fixed income portfolio is positioned well for a rising rate environment.
At Intrepid, we value equities differently than what you’ll find at most traditional shops, or what you may read in a textbook. We discount cash flows, which of course is widely practiced across the industry, but how we determine normalized free cash flow and how we determine our discount rate, are two things that differentiate us.
Traditional finance uses the WACC, which is the Weighted Average Cost of Capital, as its discount rate for each respective company. While it sounds great in theory, accurately determining the WACC is difficult, and the WACC itself has many drawbacks. In short, the WACC is whack. It has many input variables, including interest rates, cost of debt, cost of equity, and beta. What you’ll find is small changes in some or even one of these variables can have a material effect on the value it spits out for a stock. This is one reason why we do not use the WACC. Let’s look at an example of how one change makes a huge difference.
I’m going to try to keep this simple. Here we have a company that generates $12 million in free cash flow, has a capital structure comprised of 50 percent debt and 50 percent equity. It’s growing at three percent and has a 20 percent tax rate. When its interest rate is three percent, the resulting WACC based on those assumptions is 6.2 percent. This results in an equity value of $225 million.
Now, this is where it gets interesting. Let’s assume interest rates increase by only two percentage points to five percent. The WACC, using all the same assumptions, increases to 7 percent. The resulting equity value is now $150 million. Poof. Just like that, 33 percent of the equity value vanished. Keep in mind that if some of the other variables change, things could get even uglier. Interest rates can move quickly. This is just one example of how drastic the effects can be. Bottom line, increasing rates tends to hurt valuations using the WACC, while decreasing rates, like we’ve seen on average over the last 30 years, tends to help equity valuations.
You may be wondering, if you don’t use the WACC, then what do you use? We take more of a bottom up view in determining a discount rate. By that I mean we start off with a deep dive fundamental analysis of the company. We take into consideration the risk inherent in the business, as well as industry risks. The discount rate we use is what we believe we should get paid if we were underwriting the business. Typically, our discount rates range from 10 to 15 percent, which tends to be higher than what a calculated WACC would be in today’s environment.
Our discount rate captures normalized rates and borrowing costs, and it does not change often. They are not driven by macroeconomic changes. Therefore, our equity evaluations have little volatility. And to echo a point that Matt made, the price of a stock may change very quickly. But what people forget is rarely does its value change as rapidly. Times like this are when we step in and take advantage.
Turning to fixed income, I’m going to explain why we believe we are positioned well for rising rates, and then compare some of the country’s most popular bond funds to what we have to offer at Intrepid.
Many of you may have heard Mark Travis say we’re willing to take credit risk not interest rate risk. We do not want to risk losing money due to macroeconomic factors out of our control. Therefore, our bond research process is much like that on the equity side, beginning with a deep dive fundamental analysis. The upside to bonds may be limited, but what we want to be certain of is we’re going to get paid back in full. Ultimately, we have to make a decision as to whether we’re being appropriately compensated for the associated credit risk. We ask ourselves, at what rate will we lend to this company in a private transaction? Today, there are plenty of high quality companies out there with strong credit metrics, but the bonds hardly even yield more than treasuries. High yield is where we prefer to be, but we have found a disconnect in recent years between yield and risk.
As I said earlier, we think that our fixed income portfolio is positioned well for rising interest rates, and here are a few reasons why. To start, we have low duration. Duration is a commonly used measure to gauge interest rate risk. The higher the duration, the greater the sensitivity to changes in rates. The effective duration of the Intrepid Income Fund is only 0.9.
Generally speaking, our portfolio looks different than the average bond fund. We own many bonds that are not in indexes, which prevents a lot of funds from being able to buy them. About 25 percent of our holdings are unrated by a major rating agency. Most of our holdings are small issues as well. Large funds tend to own larger issues for example. On average our holdings are one third to one sixth the size of those in the popular bond funds that I’ll talk about in a few minutes.
Currently our portfolio is roughly even split between high yield and investment grade debt. When we can’t find attractive high yield ideas, we move to short term investment grade paper. We have a smaller portion in treasuries, which are finally yielding a little bit more. They’re highly liquid, so we can take advantage of volatility.
Next, let’s compare some bond funds. A quick and easy way to see what yield you’re getting relative to interest rate risk being taken is to look at the current yield versus the duration. Current yield is the annual coupon divided by the current price. Plotted here, you can see three dots over to the right, which are three very popular bond funds that in aggregate manage over $300 billion in assets. That’s a lot of money. The point here is if you are an individual investor with bond exposure, there’s a decent chance you’re invested in one of these funds, whether it’s through a financial advisor or through a 401(k) plan.
So what are you getting? You can see they have effective duration ranging from about six to nearly eight, and current yields hovering right around three percent. Said another way, these funds have durations that are more than double their current yields. The fund farthest to the left is the Intrepid Income Fund. I’d point out the Intrepid Capital Fund, which is a balanced strategy, has 100 percent overlap with its fixed income holdings, But I’m focusing on the Income Fund for this example. It has a current yield over three times its duration. The other fund to the left is a popular short duration fund with about $40 billion in assets. Even though it is mandated to have short duration, it has about 50 percent more duration than the Income Fund and has about the same current yield.
Perhaps past performance is why these funds have about $340 billion in assets? Let’s take a look.
Here we have performance over the last six months, three years, and five years. Despite their popularity, these funds have underperformed in each period. I’d point out it wasn’t until the last six months that US Treasury yields have really spiked. The ten-year Treasury yield is up about 70 basis points, and the two-year Treasury yield is up about 92 basis points. While it’s only six months, it’s a period of rising rates. The performance over this period is particularly interesting. All of the competing funds lost investors’ money over the last six months. Meanwhile, the Intrepid Income Fund returned a positive 1.7 percent. Looking out to three and five-year returns, which are the middle and right bars, it shows continued outperformance by the Intrepid Income Fund.
We may not manage $340 billion in assets like these other funds, but it’s our opinion that we have a compelling argument as to why we may be a good option for certain investors looking for bond exposure.
To wrap up, rising rates is one of the most important themes for the market in the near future. As Hunter discussed, there are many companies with floating rate debt that will immediately feel the effects of any increase in rates. A minor increase can make a significant difference to earnings and price multiples of businesses. The effects are not just limited to valuation multiples. Higher rates can impact the market landscape in other ways, such as higher volatility and inflation, as Matt discussed earlier.
At Intrepid, our valuations are based on long-term judgments that are less sensitive to short term moves in rates. We believe the funds we manage are well-suited to perform well relative to peers in a rising rate environment. With that, I’ll turn it over to Matt Berquist.
[End of Audio]