Performance
Performance data quoted represents past performance and does not guarantee future results. Investment returns and principal value will fluctuate, and when sold, may be worth more or less their original cost. Performance current to the most recent month-end may be lower or higher than the performance quoted and can be obtained by calling 866-996-FUND. The Funds impose a 2% redemption fee on shares held for 30 days or less. Performance data does not reflect the redemption fee. If it had, returns would be reduced.
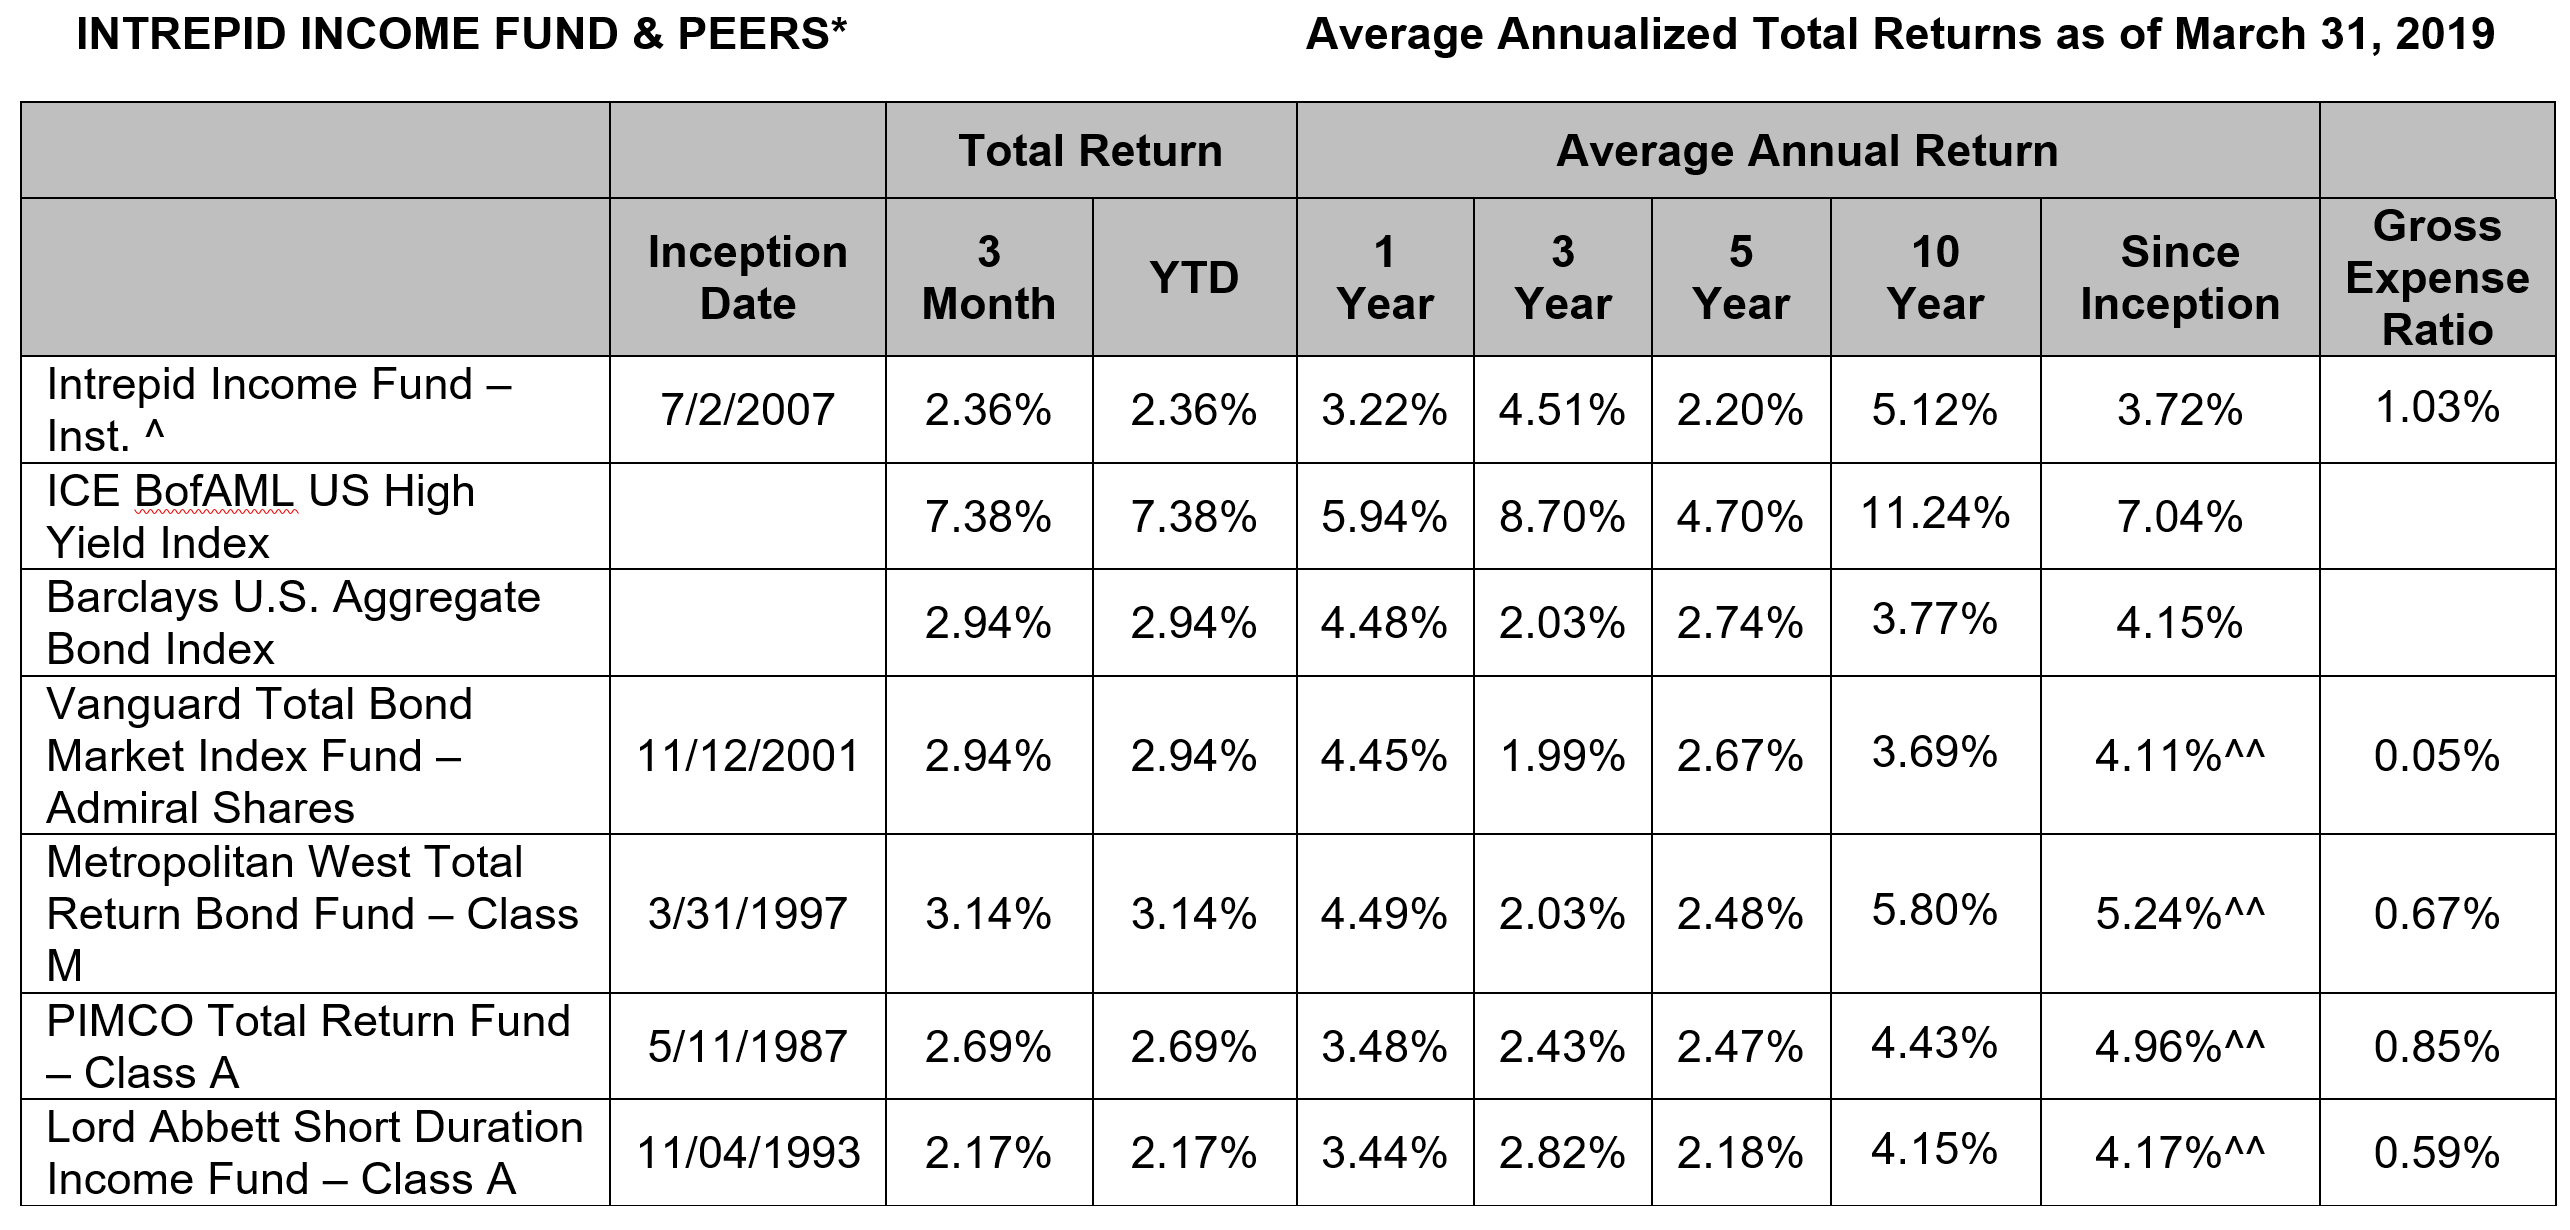
* Fund share classes shown are the largest class by assets under management for each fund
^ Institutional Class shares of the Intrepid Income Fund commenced operations on August 16, 2010. Performance shown prior to August 16, 2010 (Since Inception) reflects the performance of Investor Class shares, which commenced operations on July 2, 2007, and includes expenses that are not applicable to and are higher than those of Institutional Class shares.
^^ Since Inception returns are as of the Intrepid Income Fund’s Investor Class inception date (7/2/07). The annualized since inception return for the Vanguard Total Bond Market Index Fund – Admiral Shares (VBTLX – 11/12/01) is 4.14%, for the Metropolitan West Total Return Bond Fund – Class M (MWTRX – 3/31/97) is 6.08%, for the PIMCO Total Return Fund – Class A (PTTAX – 5/11/87) is 6.67%, and the Lord Abbott Short Duration Income Fund – Class A (LALDX – 11/04/93) is 4.14%.
Per the Prospectus, the Intrepid Income Fund’s Advisor has contractually agreed to reduce its fees and/or reimburse the Fund to ensure that the Fund’s Total Annual Operating Expense after Fee Waiver and/or Expense Reimbursement does not exceed 0.90% for the Institutional Class through 1/31/20. The Net Expense Ratio represents the percentage paid by investors. Otherwise, performance shown would have been lower.
Transcript
Jordan Slingo:
Good afternoon. Welcome to Intrepid Capital Management’s webinar. My name is Jordan Slingo, and I’m a portfolio manager here at Intrepid. With me today are Mark Travis, Joe Van Cavage, Clay Kirkland, Matt Parker, and Hunter Hayes. They’re going to give an update on the company, some recent changes at the firm, evolution of the investment process here, and why we’re so excited about the future.
But first, for compliance purposes, I need to direct your attention to the next couple of slides of the presentation. We’re going to pause for a few moments to give you a chance to read those disclosures, and then move on.
And with that, I’m going to pass the call over to Mark Travis, president and CEO of Intrepid Capital.
Mark Travis:
Thank you, Jordan, and thank you to everyone joining on this call. I’d like to start by briefly discussing where Intrepid has come from, and then as forward-looking investors, spend more time on where it’s going.
Intrepid was founded over 20 years ago with a guiding north star vision of generating attractive investment returns for its clients without exposing them to undue risk. Our goal is to participate on the upside markets, protect on the downside, and do so by remaining disciplined at assessing risk we take with our clients’ capital over a full market cycle, something we believe we have done quite successfully.
However, as co-investors with our clients, we share in the disappointment many of you have in the returns of the firm’s strategies over the last several years. We believe some of this can be explained by a shift in investor preferences away from Intrepid’s bread and butter style of buying proven companies at attractive prices. Instead, markets have been rewarding companies with high growth prospects but unproven business models, large cash burns, and no line of sight to generating positive earnings, a process that de-emphasizes valuation discipline and downside protection, and results in less demand for the steady cash flow in stocks that we like to own.
Our efforts to maintain high active share and avoid what we view as serious risk associated with the crowding of the largest, most well-known stocks, has also worked against performance, as investors neglect opportunities not included in the popular indices. We have operated our strategies over many market cycles and have seen this sort of behavior come and go before. As a result, we are confident in our sensible strategy of targeting established companies with attractive valuations, high and consistent cash flow generation, and steady growth trajectories, qualities that have generally come back into favor when volatility rears its head in markets, such as the fourth quarter of 2018.
But we also acknowledge that some of our disappointing performance is a reflection on improvements we could make to our investment process. After a deep dive review to identify the factors that drove our results over the last couple of years, we decided to take necessary steps to rectify where we went astray.
To start with, people. We have a new investment team that is hungry, energized, and excited for the opportunity to shape the future of the company and its process. Clay Kirkland is managing the small and midcap focused discipline value fund, which merged in January with the select fund. Matt Parker and Joe Van Cavage are overseeing the small cap endurance fund. I continue to manage the Intrepid balance fund, and Hunter Hayes and I are responsible for the income fund, which is concentrated in short duration corporate debt.
All these gentlemen are veterans of Intrepid and its philosophy, but are in new roles that are bringing much needed fresh eyes to the process.
Second, adjustments we have made to our process with the new team will address the issues responsible for the performance of the recent past. I’ll let the team go into more detail and provide examples, but they involve increased emphasis on certain qualitative measures, creating guardrails to prevent mistakes made when averaging down on value traps, and being more open-minded about opportunities that can grow and compound returns.
Aside from these incremental changes, one major change we’ve made is the decision to discontinue our international equity strategy. As part of our review of our core competencies, we determined that our process is more likely to outperform in small, midcap domestic strategies where the team has more knowledge and experience. As a result, we’re in the process of closing the international fund and sharpening our focus on our core opportunity set of small and mid US companies.
Finally, and most importantly, this team has implemented a culture of collaboration that is already paying dividends in regard to idea generation. To summarize, following the results of the last several years, there were required changes needed to the team, and likewise to Intrepid’s culture and investment process in order to create an environment of continuous improvement. Without further ado, I’ll pass the call to Joe Van Cavage to go through these process improvements with a bit more granularity.
Joe Van Cavage:
Thank you, Mark. To those listening, I want to reiterate what Mark said a minute ago about the excitement on the ground here at Intrepid. As co-investors in the strategies, we are excited and optimistic about the impact these changes can have. Before getting into the details, the genesis of many of these changes came from an extensive postmortem review the investment team undertook early this year that went over every idea, winner or loser, that Intrepid sold last year.
In our review, we evaluated the quality of the original investment thesis, how each position was managed as that thesis did or did not play out, and what the end result was of each of these decisions.
At a high level, our major takeaway from the evaluation of our losers was that these mistakes typically could be attributed to having too deep a focus on the quantitative side of a cheap stock in a market where valuations were elevated. As a result, we put too little emphasis on certain qualitative indicators, and guardrails intended to limit downside, when what were potentially good ideas turned into value traps.
Specifically, we found that our biggest learnings had two major themes in common: a lack of appreciation for the influence of management quality and incentives to realize value; and a lack of risk control to prevent averaging down on ideas where an investment thesis was not playing out as planned. Both of these issues were at play in each of our largest losers from 2018.
We are adjusting to this finding by making our assessment of the major teams we invest behind a much more important part of our decision-making process, and to protect against averaging down on positions that are not playing out well, we’ve created several internal rules to limit our exposure to these potential value traps. We expect these changes to, one, increase our exposure to more capable management teams, and two, create guardrails to limit large mistakes. In addition, we have set tighter controls around the amount of cross-ownership of any one stock in our strategies.
Finally, our last big change has to do with limiting a different type of mistake. As part of our postmortem review, we noticed a pattern when assessing some of our biggest winners. Despite large gains and successful investment theses, our strict valuation discipline forced us to sell some great companies growing at highly attractive rates as soon as they crossed our valuation threshold. Our view of these opportunities at the end of the year concluded that we were occasionally too early, i.e., we were often undervaluing the importance of higher-grade prospects. We’ll account for this quality differently going forward.
These were the primary updates to Intrepid’s investment process following our 2018 postmortem review. There are important changes to how we implement our research and portfolio management process, but I want to emphasize that they do not reflect a wholesale redesign of our investment philosophy. We remain grounded in our value-oriented and opportunistic discipline of evaluating risk just as much as potential reward. With that in mind, the changes I discussed are tweaks to improve what is a proven strategy that we have seen work over market cycles, and not a revamp of the core tenets of what Intrepid does.
The more important takeaway is the culture of continuous improvement and collaboration with regard to the process and how it will drive performance. So with that in mind, we’re excited now to talk about some of the new ideas that have been generated as a result of these process improvements, and I’ll just get right into it with some examples.
The first is Take-Two Entertainment, a market-leading video game publisher with a market cap of approximately $12 billion, a pristine balance sheet, and several of the most well-known video game properties. Take-Two has a very strong management team in place, led by a chief executive who prioritizes development of quality content and cultivating the company’s greatest asset, its game developers.
At first glance, Take-Two is in an industry that is characterized by lumpy financial results on a year to year basis, as major new game releases don’t necessarily come out each fiscal period. However, Take-Two’s results are increasingly driven by what the company calls recurrent consumer spend, which is incremental money spent on video games after purchasing the game, like downloadable content or micro transactions.
This source of sales actually accounted for 62 percent of net bookings last fiscal quarter, and grew 27 percent year over year. We believe the growth in recurrent consumer spending will reduce the lumpiness or volatility of Take-Two’s results looking forward. And as a result, we were happy to acquire Take-Two stock during a year when they were lull in major new releases. While the company doesn’t necessarily look cheap, with a P/E multiple in the low twenties, we think this ratio is likely to shrink dramatically when the next new major game is released, and earnings growth should accelerate, which we expect within two years.
In the meantime, recurrent consumer spend should continue to grow with the tailwinds of e-sports, next generation console releases, and growth internationally. To summarize, as one of our newer ideas, Take-Two is a great example of the sort of opportunity our new process tweaks have yielded. Our thesis in take two is based on a strong valuation case looking forward, supported by the firm’s attractive growth prospects and capable management that has proven the ability to extract value from the company’s video game properties.
And then Protector Forsikring is another idea where our new focus on the value of growth and quality management comes into play. Protector is a fast-growing Norwegian insurer led by a visionary CEO that’s carved out large and improve market shares as an upstart in the oligopolistic Scandinavian markets. With average premium growth of nearly 25 percent in the five years through 2017, Protector’s trading multiple relative to its book value expanded over three times by the end of that year. Protector then hit some growing pains caused by entering new markets and an unexpected underwriting issue in one of its core businesses, which caused the stock price to fall by over 60 percent between January and October of 2018.
After reviewing how the company reacted to these issues, namely by committing to slower but still attractive growth and exiting the problematic insurance line, we took the opportunity to purchase the fast-growing company with excellent leadership at what we consider an attractive discount.
Finally, Cabot Oil and Gas is another company with great management, great assets, and an attractive growth profile. Cabot is one of the country’s largest natural gas producers out of its property in the Marcellus Shale in Northeast Pennsylvania. Because of where its reserves are located, it can extract gas more easily than most competitors, giving Cabot the one defensible advantage in commodity industries: a position as the low-cost leader.
Cabot’s executives have managed this advantage in a responsible way, developing the property at a measured pace that allowed the company to grow within its means and maintain a strong liquid balance sheet. Today, with catalysts in place to increase their takeaway outlets and price realizations, they are turning on the growth spigot by committing to a 20 percent production growth pace while reducing capital expenditures, creating an impressive amount of free cash flow in an industry that typically generates little to none. And management has also committed to returning over 50 percent of this free cash flow directly to shareholders.
Cabot’s management has created a business that has been able to generate a 23 to 31 percent free cash flow return on equity dependent on gas prices with low financial risk and should be able to grow at least 20 percent a year. If these were the qualities of a general industrial company, we would expect it to trade higher than the 7.5 times pretax cash flow, which we define as earnings before interest, taxes, depreciation, and amortization, or EBITDA, that Cabot does today. As a result, we view it as another attractive opportunity to buy a great company with strong management and attractive growth profile and at an inexpensive valuation.
With that, I will pass the line to Clay Kirkland to discuss how the different strategies are working together to add value in our idea generation process.
Clay Kirkland:
Thanks, Joe. Vistra Energy was a new equity purchase late last year, an idea we are very bullish on. Vistra is our country’s largest independent power producer and was spun out of a large bankrupt entity in late 2016. However, the company itself is not bankrupt, and in fact, has a very strong balance sheet that has allowed it to initiate a dividend and announce a share repurchase authorization for over ten percent of its stock, all while paying down debt at the same time.
Debt investors seem to have picked up on Vistra’s improved capital structure, and the company has been refinancing its existing debt in an aggressive manner. By contrast, equity investors are treating Vistra as if it’s still part of a bankrupt, distressed organization. We measure this by comparing the yield on the company’s recently issued debt, which was used to refinance the legacy bonds, with the free cash flow yield on the company’s stock. At a 19 percent free cash flow yield, which is a 14 percent equity risk premium to where the newly issued bonds are treading, the spread is more consistent with the stock of a financially distressed company than a company paying down debt, aggressively repurchasing shares, and initiating a dividend.
Compare this to the opportunity set represented by the broad market average, where the equity risk premium or excess free cash flow yield[1] over corporate bonds[2] is only 1.2 percent. So as equity holders, we’re getting about six times the relative yield and three times the absolute yield on Vistra’s free cash flow generation. And as opportunistic value investors, we try to exploit volatility when we can, so despite the bond market being much more attuned to Vistra’s strong credit quality and plan to pay down debt over the next two years, by following the company closely as shareholders, we were able to seize an opportunity in January when their nearest dated notes, due in 2022, traded down to yield more than six percent, which is an attractive spread to similarly rated notes at the time.
It was the team’s increased focus on collaboration across asset classes that allowed us to opportunistically invest across the capital structure in what we view as an attractive misunderstood opportunity for the benefit of our clients.
Ingles Market is another example. Instead of misunderstood, I’d describe this one as under-followed. Ingles is a small regional grocery chain with approximately 200 stores in only 6 states within the Southeast US. Its small, rural focus has actually been an advantage and allowed it to put up attractive and steady financial results, despite the explosion of competition in the grocery store category over the last few years. This can be attributed to management’s aggressive investment in updating its store base, but also due to its geographic focus on rural, low population density areas that has deterred competition from moving in. For example, Ingles has three stores in Franklin, Tennessee, but no stores in Atlanta, Georgia.
Ingles is closely held and controlled by the founding family. However, it has been run to the benefit of all shareholders, in our assessment. The company is doing well, with comps currently growing at three percent and expanding gross margins. However, the closely held nature of the stock, and lower than average liquidity, means that it’s not held in many indices.
When the stock sold off in late 2018 to trade at less than ten times its historically stable earnings, it caught our attention. In our due diligence, we noticed the bonds also traded at attractive levels. While Ingles is a more leveraged company than we typically invest in, they are also in the rare position of owning about 80 percent of the shopping centers where they operate. This ample asset coverage from the owned real estate can drastically reduce the financial risk on both the equity and debt side.
Finally, in our constant search for where risk is mispriced, we have found some interesting opportunities in the energy space within Colorado. In that state, which is the fifth largest energy producer in the country, heightened political risk for operators emerged in late 2018, due to potentially draconian drilling regulations in response to environmental concerns. Combined with a decline in oil prices at the end of the year, the stock and bond prices of many of the players in that region sold off dramatically.
Since then, the political party that controls the State House, Senate, and Governor’s Office passed legislation aimed to address concerns about the industry’s lack of regulation. Uncertainty still exists, as the final rule-making process is ongoing, but our research suggests that upcoming changes will be very manageable for the industry. As such, we have used the opportunity of higher uncertainty in this region to purchase securities at prices that we think over-discount the political risk and provide an attractive risk/reward tradeoff.
We have selectively purchased the equity of Bonanza Creek Energy, which we believe is best positioned to handle any adverse regulatory outcome, due to the specific geographic location of its land. It also has a great balance sheet to help weather any regulatory adversity that emerges from here.
An example on the debt side is Great Western Oil and Gas. It’s a private company, but it has public bonds due in 2021. We found the roughly 20 percent yield as a very attractive risk/reward relative to the perceived political risks and credit risks, given less than two turns of leverage on its balance sheet.
So that was a rundown of some of our newer holdings that were generated from the improvements we’ve made to our investment and research process. We have been more active than just these examples, especially during late 2018 and early 2019, when volatility spiked in the markets. We were opportunistic and took advantage of that volatility by introducing a lot of new names on both the equity and debt side. It was our most active period in quite some time. While volatility has subsided in 2019, and markets have rallied substantially, albeit with a pullback in May, we would note that market strength has been less broad overall, leaving room to continue to find attractive opportunities, although not at the same pace as in December.
But with the new team, the improvements to the process, and an increasingly collaborative culture in place, we’re already seeing meaningful benefits in our idea generation, and are excited for how this could drive improved performance in the future.
Now Matt Parker and Hunter Hayes will discuss what we as a team are seeing in equity and fixed income markets, and how we have positioned the portfolios in response.
Matt Parker:
Thank you. I’d like to start with some of the major risks we see in the equity markets today, which we would continue to describe as elevated overall. One major indicator of investors’ especially strong appetites for risk is the IPO market. University of Florida finance professor Jay Ritter has compiled data on IPOs going back to 1980. The percentage of unprofitable companies listing in 2018 reached 83 percent, which is the highest in this nearly 40-year data set, even higher than the 81 percent mark set in the tech bubble of 2000.
And one thing we find interesting about these unprofitable companies is how well the stocks have performed after listing. A recent study by Pitchbook examined the median annualized stock returns for profitable versus unprofitable companies with valuations above $1 billion. Profitability in this case is defined as EBITDA margin at the time of IPO. The disparity between the two in 2018 is striking. The median unprofitable company returned nearly 120 percent, while the median profitable company lost almost 60 percent. There are obviously factors such as sample size, sector, and individual company-specific characteristics that account for much of this difference, but nonetheless, we believe it illustrates the strong investor demand for stocks of companies with more speculative future payoffs.
Twenty-nineteen has also been marked by a number of highly anticipated IPOs. On this slide, we picked five of the more notable ones: Uber, Lyft, Pinterest, Zoom Video, and Beyond Meat, and shown their current trailing 12-month EBITDA margin. Of these, only Zoom Video is profitable. Uber, Beyond Meat, and Lyft each have EBITDA margins of negative 20 percent or worse.
Conventional valuation metrics, like price to earnings or enterprise value to EBITDA, are tougher to use for companies like these. When measuring current statistics, price to sales is a commonly used metric for unprofitable companies. This chart shows price to sales for each of the previously mentioned businesses. These sorts of multiples are reminiscent of what we saw in the tech bubble of the late nineties. After that bubble burst in early 2000s, many people acknowledged the folly of paying so much for these stocks.
Scott McNealy, one of the cofounders of Sun Microsystems, was interviewed by Bloomberg in 2002, and expressed the same incredulity about his own company’s stock valuation during the tech bubble. Quote,
Two years ago we were selling at ten times revenues, when we were at $64.00. At 10 times revenues, to give you a ten-year payback, I have to pay you 100 percent of revenues for 10 straight years in dividends. That assumes I can get that by my shareholders. That assumes I have zero cost of goods sold, which is very hard for a computer company. That assumes zero expenses, which is really hard with 39,000 employees. That assumes I pay no taxes, which is very hard. And that assumes you pay no taxes on your dividends, which is kind of illegal. And that assumes with zero R&D for the next ten years I can maintain the current revenue run rate. Now having done that, would any of you like to buy my stock at $64.00? Do you realize how ridiculous those basic assumptions are? You don’t need any transparency. You don’t need any footnotes. What were you thinking?
Famed investor John Templeton put it more succinctly when he called stocks trading at 20 times sales temporary insanity. I will note the Pinterest value of 18X sales nearly matches this level, while the 62X and 72X multiples of Beyond Meat and Zoom Video are far higher still.
I’d like to point out that we fully recognize these businesses have excellent products with long growth runways that have disrupted more traditional business models, and while we’re skeptical of the trading multiples, we acknowledge that some of these stocks could very well turn out to be great investments. We would just note that these are not the sort of stocks we wager on at Intrepid. We prefer proven cash generating businesses trading at reasonable multiples. Our view of elevated risk as represented by the exuberant market for unprofitable IPOs doesn’t mean we don’t see any opportunities, as Joe and Clay highlighted earlier. But these elevated risk factors are something we keep in the front of our mind when allocating your capital and underwriting the opportunity set in the marketplace.
We’re reacting to these risks by remaining focused on our valuation discipline on high cash flowing companies and targeting high active share by increasingly sourcing opportunities outside of the popular indices. As such, our equity strategies all have average valuation metrics, such as price to earnings and price to book ratios that are well below the averages of their benchmark small, mid, and large cap indices. We recognize that these ratios are not end-all measures of the attractiveness of our holdings or their true values, but nonetheless, this positioning is intentional, as we’ve tried to avoid securities characterized by huge growth potential, but little or no profits, as these have been a large driver of the rising valuation in the markets, and likely are not providing adequate future returns that compensate for the elevated risks of these unproven business models.
Valuation conservatism has carried a high price in terms of relative underperformance over the last five or so years, both for Intrepid and other value-oriented peers. The historic underperformance of value, and particularly small cap value relative to growth in large cap, has been well-documented. According to Morningstar’s Style Box indices, small cap value as a style has underperformed large cap growth by more than 13 percent over the past 3 years. As of May 31, 2019, the two styles had annualized returns of 1.80 percent and 14.99 percent. The relative performance of growth and value has shown strong mean reversion over long periods of time, and we are confident than buying stable, cash generative businesses at reasonable prices will come back into favor. Small cap value has historically been one of the highest returning equity categories over multi-decade periods, so history does not suggest this current underperformance will persist over the long term.
In the meantime, we remain steadfast in our philosophy of targeting high cash flowing market leaders and steady, predictable, end markets, emphasizing the preservation of capital, and ensuring potential reward adequately compensates for risk, and remaining flexible to quickly adjust and take advantage of opportunities when volatility appears in any sector, industry, or the market as a whole.
Now Hunter will discuss our outlook and recent positioning on the fixed income side.
Hunter Hayes:
Thanks, Matt. When talking about our outlook in the fixed income portfolios, we first want to highlight some of the elevated risks we see. Low interest rates have had a circular effect. Companies have taken on tremendous amounts of cheap debt, but this couldn’t happen without yield-starved investors willing to receive very little in return. It has been exacerbated by the fact that the companies with the most leverage, the ones we think should be deleveraging, are the ones that continue to add even more debt.
The feedback loop is enabled by those yield-starved investors trying to hit a return target in a low interest rate world, and only finding a return to accommodate that target in the riskiest places.
The circled line on the chart is the median net debt to EBITDA of the most highly levered quartile of the riskiest corporate debt issuers in the US, as measured by their credit ratings.[3]
Since 2014, leverage for the riskiest part of the high yield market has increased from about five times profitability to close to nine times. The rise in leverage is also enabled because we have yet to see a spike in defaults.
Broadly speaking, leverage in the credit markets has been on the rise. Historically, when corporate debt to GDP peaks, a spike in defaults usually follows shortly thereafter. You can see that the blue line on the chart is above any prior peak. Yet as you can see with the green line on this chart, default rates are still very low. We are not trying to make a macro call, but with these things in mind, we have positioned the fixed income portfolio in such a way that we believe will result in favorable outcomes regardless of what happens.
The next slide summarizes some of the increased risk debt holders are facing as a result of underwriters including less protections in credit agreements. Covenants, or lender protections, are becoming both less common and a lot weaker. In particular, US leveraged loans that are considered covenant light are at a peak of almost 80 percent of outstanding loans, which means there’s nearly $1 trillion worth of covenant light loans outstanding. Data show that covenant light loans recover far less than a loan with regular covenant protections. This has become an issue that even the Fed is starting to opine on, saying in recent reports that leveraged loans standards are deteriorating, and that risks with leveraged loans have intensified, as a greater proportion are to borrowers with lower credit ratings and already high levels of debt.
Private equity firms are some of the primary culprits behind this trend. Over the past couple of years, the percentage of private equity-backed loans issued that were considered covenant light was very high. Without these protections, bond holders have little say, and have increasingly been put in precarious positions. We’re acutely aware of these collective developments in the bond markets, and as such, are incorporating higher credit risk and lower recovery assumptions into our analysis and seeking to avoid situations where credit quality and protections are likely to worsen.
In addition, we have shifted our positioning over the last six months to take advantage of unique and opportunistic situations. Part of the shift has effectively kept the duration of the portfolio pretty low. This is in response to the interest rate risk we mentioned above, and the fact we believe that taking on additional duration or interest rate risk is not something our clients are getting paid adequately for.
Our goal has been to do so without giving up yield, and in many cases, we’ve been able to do so. We think this is a meaningfully competitive advantage.
Here are some current statistics on our Income Fund, which we think uniquely positions it in the current environment. Duration is only 1.12 years [as of 5/31/19], which is well below most short duration funds out there, and one of the reasons we believe our Morningstar classification as a multi-sector bond fund is incorrect.
The fund holds about 25 percent in what we would categorize as unique or uncorrelated debt, meaning oftentimes unrated issues, small issues, and many issues that are not in the indexes. At the end of May, our Income Fund held over 40 percent in investment grade rated debt.
What we are trying to accomplish on the fixed income side is to have a portfolio that has high credit quality and short duration, but yields like a portfolio with lower credit quality or longer duration. To do so, we are increasingly using the fund’s small size as a competitive advantage by sourcing small deals that larger competitors with a short duration focus are unable to buy, which has given us opportunities to earn highly attractive yields on excellent low duration credits.
GE is a great example of getting higher yield without additional credit risk. We purchased some GE floating or variable rate notes earlier this year. This bond checks a lot of the boxes I talked about earlier. It’s a super small issue that large competitors cannot purchase, and it’s puttable January 1 of next year. We bought the bonds at a five percent yield, while another GE issue that is over $1 billion and due January of next year was yielding less than three percent. So we were able to pick up over 200 basis points or 2 percent of yield without taking on additional credit risk, since the debt was from the same issuer, and level in the capital structure.
The next example is Vitamin Shoppe. Earlier this year, we purchased busted convertible bonds due in December 2020. Busted converts are company bonds that have the right to convert into stock, but are unlikely to, since the stock is far below the convert price. Again, this is a small issue that is off the radar of big shops, and most convertible bond buyers, since the stock has little chance of reaching the conversion price. The company has low leverage and has actually repurchased over half of the issue.
Vitamin Shoppe is undoubtedly going through some tough times, but we believe its credit worthiness is quite high for the next 18 months. Our initial purchases were at yields in excess of ten percent.
Our core philosophy hasn’t changed. We are focusing on financially strong companies with steady cash flows who are not reliant on the credit markets to pay back the debt we hold. As you can see, Vitamin Shoppe can cover all the outstanding debt with its current revolver. We believe the Income Fund is positioned now like a full-blown short duration fund, yet we have been delivering a very competitive current yield relative to the large stalwart players in the space, while subjecting our investors to much lower interest rate risk than these peers.
With that, I will pass it back to our president and CEO, Mark Travis, to close the discussion.
Mark Travis:
Thanks, Hunter. I hope the discussion above was helpful in describing the changes in investment team and process, examples of where these changes have driven improvements, and why there’s so much optimism and excitement about how they will impact performance looking forward. Intrepid’s style and philosophy of carefully consumed risk alongside potential reward has been through many different market environments, cycles, economies, and even Federal Reserve governors. There have been times when it looked out of touch with reality, and other times, like in the fourth quarter of 2018, when rampant volatility took over the markets, and major indices fell between 13 and 21 percent, when this investment philosophy seems like a genius approach.
We are proud of how we performed during the recent period of volatility, consistent with how we have in the past during other periods of wild market fluctuations. But the real value in our process is our steadfast dedication to its core principles in all market environments. We believe this allows us to avoid undue risk when they’re not priced adequately, take advantage of them when they are, and as a result, construct portfolios that have the potential to create attractive returns over time.
Where we have fallen short in the recent past has been on participation during periods where markets are rallying sharply to the upside. The changes we’ve made to our team and process are designed to address this issue, while remaining consistent with our core investment philosophy. Importantly, our core processes and differentiators relative to traditional asset management remain in place. We identify unique opportunities with high active share and have the flexibility to invest in securities that are outside the indices or too small for larger investment managers. We evaluate and appraise a business based on its expected cash flows over a full market cycle, rather than extrapolating recent results. We focus on generating attractive absolute returns rather than relative returns.
As I mentioned before, collaboration and excitement on the team has never been higher, and we are optimistic about how this will translate into future performance. We thank you for your trust and investment. With that, we’ll open up the line to Q&A.
[End of Audio]
[1] As represented by S&P 500 free cash flow yield
[2] As represented by ICE BAML US Corporate Index yield to maturity
[3] B & CCC-rated US issuers