PERFORMANCE
Performance data quoted represents past performance and does not guarantee future results.
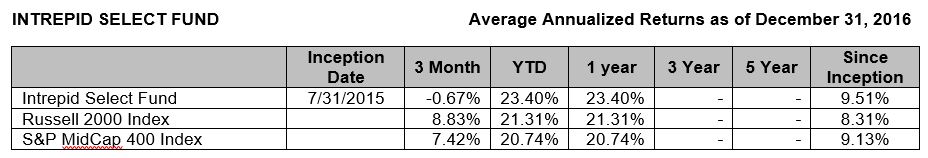
Investment returns and principal value will fluctuate, and when sold, may be worth more or less their original cost. Performance current to the most recent month-end may be lower or higher than the performance quoted and can be obtained by calling 866-996-FUND. The Funds impose a 2% redemption fee on shares held for 30 days or less. Performance data does not reflect the redemption fee. If it had, returns would be reduced.
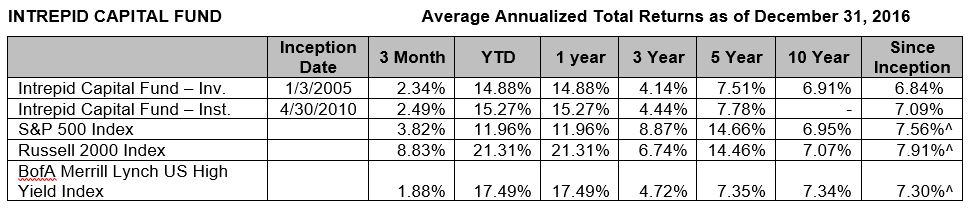
^Since Inception returns are as of the Fund’s Investor Class inception date. Since the inception date of the Institutional Class, the annualized return of the S&P 500 Index is 12.35%, Russell 2000 Index is 11.57%, BofA Merrill Lynch US High Yield Index is 7.30%.
Per the Prospectus dated January 31, 2017, the Fund’s annual operating expense (gross) for the Investor Shares is 1.45% and for the Institutional Shares is 1.40%. The Fund’s Advisor has contractually agreed to waive a portion of its fees and/or reimburse expenses until January 31, 2018 such that the Net Expense Ratio for both the Investor Shares and Institutional Shares is 1.15%. The Net Expense Ratio represents the percentage paid by investors. Otherwise, performance shown would have been lower.
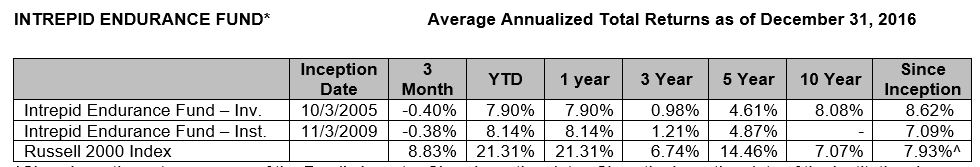
^Since Inception returns are as of the Fund’s Investor Class inception date. Since the inception date of the Institutional Class, the annualized return of the Russell 2000 Index is 14.43%.
Per the Prospectus dated January 31, 2017, the Fund’s annual operating expense (gross) for the Investor Shares is 1.46% and for the Institutional Shares is 1.40%. The Fund’s Advisor has contractually agreed to waive a portion of its fees and/or reimburse expenses such that the Net Expense Ratio for both the Investor Shares and Institutional Shares is 1.15%. The Net Expense Ratio represents the percentage paid by investors. Otherwise, performance shown would have been lower.
*Effective 6/26/2015, the Intrepid Small Cap Fund was renamed to the Intrepid Endurance Fund.
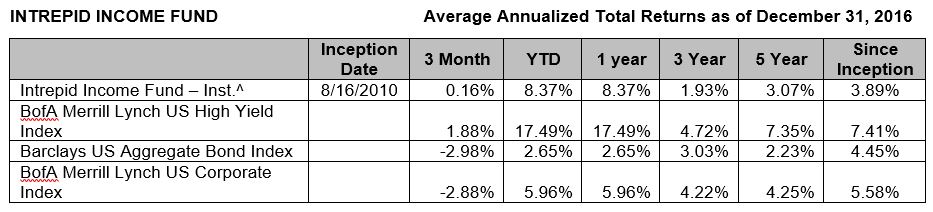
^Institutional Class shares of the Intrepid Income Fund commenced operations on August 16, 2010. Performance shown prior to August 16, 2010 (2008-2010) reflects the performance of Investor Class shares, which commenced operations on July 2, 2007, and includes expenses that are not applicable to and are higher than those of Institutional Class shares.
Effective January 31, 2014 the Investor Class shares of the Fund were closed, and any outstanding Investor Class shares were converted into Institutional Class shares.
Per the Prospectus dated January 31, 2017, the Fund’s annual operating expense (gross) is 1.03%. The Fund’s Advisor has contractually agreed to waive a portion of its fees and/or reimburse expenses such that the Net Expense Ratio for the Fund is 0.92%. The Net Expense Ratio represents the percentage paid by investors. Otherwise, performance shown would have been lower.

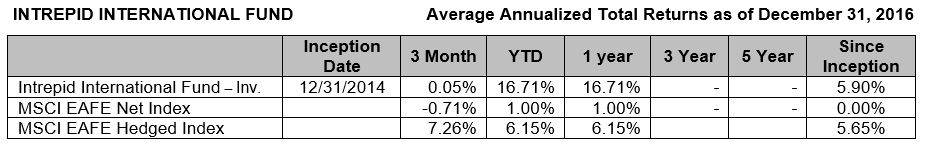
Per the Prospectus dated January 31, 2017, the Fund’s annual operating expense (gross) is 1.34%. The Fund’s Advisor has contractually agreed to waive a portion of its fees and/or reimburse expenses until January 31, 2018 such that the Net Expense Ratio for the Fund is 1.30%. Otherwise, performance shown would have been lower.
*Effective April 1, 2013, the Intrepid All Cap Fund was renamed to the Intrepid Disciplined Value Fund.
Per the Prospectus, the Fund’s annual operating expense (gross) is 2.50%. The Fund’s Advisor has contractually agreed to waive a portion of its fees and/or reimburse expenses until January 31, 2018 such that the Net Expense Ratio for the Fund is 1.40%. Otherwise, performance shown would have been lower.
Per the Prospectus, the Fund’s annual operating expense (gross) is 3.02%. The Fund’s Advisor has contractually agreed to waive a portion of its fees and/or reimburse expenses such that the Net Expense Ratio for the Fund is 1.40%. Otherwise, performance shown would have been lower.
Short term performance, in particular, is not a good indication of the fund’s future performance and an investment should not be made solely on returns. Performance data quoted represents past performance and does not guarantee future results.
Transcript
40 second intro for disclosures and performance…
Mark Travis:
Good morning, everyone. This is Mark Travis at the Intrepid Capital Funds. Welcome to our semi-annual webinar. Joining me this morning are Greg Estes, Jayme Wiggins, and Jason Lazarus, along with Matt Berquist. As we get started I just want to just reiterate what really drives us at Intrepid Capital, and you can see it on the screen. The first thing is we’re value-driven. We’re really trying to figure out what a company is worth and try to pay a discount to that worth – or, in the case of fixed income, how we’re going to get repaid over a relatively short time period.
As we talk about independence, which I’ll expand on more in a minute, we are not in any way, shape, or form a closet indexer, and that really is, I think, our value proposition. And we’re willing to hold cash. I’m really proud of our long-term performance, particularly over the last decade. You can look at our oldest two funds relative to their respective benchmarks and they’ve definitely added alpha. With that said, to have exceptional long-term performance you must be willing to suffer through some sometimes painful short-term performance.
And then, lastly, under the category of integrity we’re really doing all of our internally with the analytical team at Intrepid Capital. And maybe most importantly from my perspective we co-invest with our customers, and I think that – to a man here and in the firm, whether that’s our after-tax savings or our retirement plan savings. So, we suffer the peril and the beauty of our process here with our customers.
What I want to talk about, after a brief pause there, is where we see the marketplace today. And I know this sounds repetitive from us at Intrepid Capital, but prices are high. And really, what we have on this chart is enterprise value, which is a combination of the equity market cap debt outstanding less cash a firm may have relative to the term EBITDA, which just think of as pre-tax cash flow. And on this chart you can see that the Russell 2000, which is where we tend to find our best opportunities in the smaller cap universe is north of 20 times. You can take the inverse of that and say, “If I were to write a check for the enterprise, I’m going to get less than a five percent pre-tax yield,” which for owning a small cap, sometimes liquid minority interest may not be an adequate return from our perspective. You can see the S&P is somewhat cheaper.
And if we look at yield to worst, it’s somewhat comparable. As I like to remind people frequently, “the bankers get to eat first,” so the bonds would be superior to an equity interest. Again, the yields to worst there are also quite similar in a little over of five percent, which in the history of high yield sounds almost, to me, oxymoronic in terms of the high yield. And so, we’re going to switch back here to the screen momentarily. There we go. And you can see kind of the history of it over the last six, seven, ten years.
And so, what we’ve got going on most recently is we’ve had huge flows into passive strategies, again looking out over now the last decade. I am pleased to say that the Intrepid Capital Funds had inflows over the course of calendar year ’16, not outflows, but you can see these are just industry statistics. I would also tell you that if you look closely at the data that indexing tends to follow the market up and tends to be very popular right before market peaks. You can see that in the late ’90s. You can see it around ’07. And there are certainly some indicators that it’s occurring today. So, we’ve got an unusual period of low volatility which has, I think, is exacerbating it.
And so, last year the industry, the active fund industry had outflows of $340 billion and passive inflows of $500 billion. Again, and I don’t think whether it’s an active fund or a passive fund, unfortunately, most people – as I say somewhat sarcastically but it’s also true – buy high and sell low, and I think it’s also true of the indexes. But we’ve got some governmental regulations staring at us that I think are exacerbating, which I’ll talk about in a minute.
So, you can see on this chart again, say, a five- or six-year look at the volatility. The real last significant volatility we saw was in the summer of ’11 around the S&P’s downgrading of U.S. Treasury debt. That to us was actually an opportunity to find mispricings, which we had significant swings in our investment levels at that point. And then, you saw a very brief period once again in the summer of ’15 around the Chinese currency devaluation. It was almost a one-day event, late August of ’15. And you can see some bumps around the election. But frankly, I think a lot of the opportunities are where it spikes over 25, and that’s unfortunately where a lot of people were taking the opportunity to sell, whereas we at Intrepid Capital would be busily at work trying to find investments to take advantage of. And then, a quote from Nassim Taleb: “Don’t confuse volatility with stability.” So, today we have roughly a volatility less than 12; it’s at historic lows. And so, I would contend that when volatility is lowest you should be on your highest guard for adverse circumstances.
As I mentioned earlier, we’ve got some things exacerbating this push into passive indexation. The Department of Labor has come out with a ruling which it’s still undetermined whether it’ll take effect in April. And what the Department of Labor is doing particularly with the brokerage community is trying to get them to move to a fiduciary role, which frankly we at Intrepid Capital have operated under the last 22 years, but now the broker advisory community is going to have to decide between a suitability standard, which is where they’ve operated for most of their existence, and a fiduciary one.
So, I think that’s having – you know, it sounds the best of intentions, but I think it’s also putting pressure on money to flow into indexes. And I think unfortunately, like a lot of governmental regulation, it may have unintended consequences. We’re now toward the end of an eight-year bull market starting around February or March of ’09, and about the time that government comes out with a ruling may be the worst time to put people’s retirement plans to work in an index – which, as I’ve pointed out over the last 15 years, we’ve had numerous drawdowns in index in the neighborhood of 50% in the calendar years 2001 and ’02, and again between the fall of ’07 and early of ’09.
So, this is attributed to me but I don’t really think it’s my quote, but it’s along the lines of John Maynard Keynes, which is “Most people would be happier failing conventionally.” We’ve chosen to succeed unconventionally. I think the flow of money from “active to passive” is really one from high-cost active that really looks – it’s really high-cost passive into low-cost passive. And with that, I’m going to turn the floor over to Greg Estes, and he’s going to walk you through a couple of ways the industry looks at value-added, both active share, which tries to show how we distinguish ourselves from the index, then also the Sharpe Ratio, which is also, I think, how institutional investors allocate capital. Not just on return, but risk measures as well. And I think for people to take these into account and think over a full market cycle, we have a compelling value proposition.
With that, I’m going to turn the floor over to Greg Estes. Thank you.
Greg Estes:
Thanks, Mark. I’d like to spend a few minutes talking about active share, why it matters, and then discuss how Intrepid approaches the idea of being an active investor.
Let’s start by defining active share. This measure was created as a way for investors to understand how active a fund manager is in comparison to the fund’s underlying benchmark. You can see the official formula on the slide. Despite the fancy appearance, all it is saying is that active share can be calculated by adding up the variation in holdings between a fund’s portfolio and its underlying benchmark. For example, let’s say there exists a benchmark of only five stocks, each equally weighted at 20%. Now, let’s say that a certain fund is invested in five stocks, also equally weighted, but only has one stock in common with the index. The active share of this fund is then 80% compared to the benchmark. Basically, the higher the active share, the more active the manager is in comparison to the benchmark. An index fund which exactly mirrors the benchmark has no variation, and thus would have an active share of zero. The highest possible active share a fund could have would be 100%, which means its holdings have nothing in common with its benchmark.
Why does this matter? Well, the creators of this active share metric also studied the implications of it. They found that generally speaking higher active share was linked to active generation. In addition, further study indicated that high active share matters more in down markets and is linked to alpha during those time periods. In the table you can see the active share for each Intrepid equity fund, as well as the equity portion of the Intrepid Capital Fund. Note that all are above 95%, with three above 99%. This indicates a wide difference from the underlying benchmark holdings. As we have said before, we believe that we look for ideas where other managers do not, while staying within the investment mandates set out for each particular fund.
So, knowing what the active share for each Intrepid equity fund is, let’s look at a broader spectrum of mutual funds. According to a Fidelity study done among more than 2000 mutual funds, we can see how active share is distributed among both large cap funds in green and small cap funds in black. Note how the large cap funds are more normally distributed, while the small cap funds tend to be skewed towards its high active share. That is actually a function of the benchmarks. In the case of small caps, the underlying Russell 2000 Index has a relatively high number of holdings, and most small cap funds simply do not have nearly as many holdings. That means on average that the active share numbers tend to be higher for small cap funds than for large cap funds, which are benchmarked against the S&P 500.
The median active share among large cap funds was 75%, while the median active share among small cap funds was 95%. With all of that said, however, the Intrepid funds that are benchmarked in the small cap space are still well above that 95% median small cap fund. The Endurance Fund has an active share of 99.89%, while the Select Fund has an active share of 99.90%. Likewise, the two Intrepid funds benchmarked against the S&P 500 are well above the median 75% active share at 97.91% for the equity portion of the Capital Fund and 97.49% for the Discipline Value Fund.
The main takeaway of this is that Intrepid’s approach is extremely active. But what does being active mean? Having high active share does not indicate whether an investor is extremely aggressive or conservative or a growth or value investor. For Intrepid, being active means that managing risk is a central part of the investment process, and that finding value means that we must at times wait for a good price, and that we must frequently think outside-the-box for appropriate opportunities.
Let’s look at a fund whose benchmark has shown signs of cracking over the past couple of years. The Intrepid International Fund, shown in blue with an active share of 99.98%, is benchmarked against the MSCI EAFE International Index, shown in red. You can see that from about mid-2015 through the end of 2016 the MSCI EAFE Index has exhibited increased volatility and a net negative cumulative return. In comparison, we think that the Intrepid International Fund has found ideas that we believe exhibit outside-the-box thinking, such as Clere AG, which has been talked about in previous shareholder letters, or Dundee Preferreds, which were highlighted in our last webinar. We believe that looking where other investors do not and focusing on valuation can lead to good results against a market going through a period of high volatility.
I will finish by highlighting another way in which our approach to being active means focusing on risk. The Sharpe Ratio simply calculates a portfolio’s excess return over the risk-free rate and then adjusts it by the standard deviation of returns for the portfolio. Basically, the Sharpe ratio is calculating a portfolio’s excess return per unit of risk taken to achieve that excess return. Too often we think investors only look at returns. By including both return and dividing by the risk taken to achieve that return, the Sharpe Ratio allows funds to be compared to one another and to their respective indices.
This table shows the Sharpe Ratio for all Intrepid mutual funds since their inception dates. The last column shows the difference between each fund and its respective benchmark. In all cases the fund’s Sharpe Ratio exceeds its underlying benchmark’s Sharpe Ratio. We think that this is a testament to our value and risk-aware process, and that investors should have exposure to this type of process. We think it’s particularly important in light of peak equity and fixed income prices, which have most recently been fueled by the Trump rally.
I am going to turn the call over Jayme Wiggins, who will discuss the implications of some of the Trump administration’s policy proposals.
Jayme Wiggins:
Thank you, Greg. Let’s talk about the election. The outcome wasn’t predicted by too many folks, but the markets have certainly responded sharply to the promises being made by President Trump, and in some cases the promises being made by the Republican-controlled Congress.
The stock market has received a lot of attention, and it rose quickly in November and the early part of December. Small caps have really stood out as they are seen as benefitting more than large companies from the various proposals laid out. Stocks have moved more or less sideways over the past month, taking a breather.
Let’s go through the various proposals. This is just a list of the top ones you’ve heard about. First, reducing the corporate tax rate from 35% to 15% – now, Congress has targeted 20%. Eliminating the interest deductibility of debt, except in cases where interest expense can offset interest income. Allowing the immediate expensing of capex – so, no more depreciation. Spending $1 trillion on infrastructure – there could be some public-private element to that. Eliminating regulations. The President said within the past week that we need to remove two existing regulations for each new regulation. Instituting tariffs or border taxes. This is one of the areas with the least certainty but is potentially the most significant. President Trump has said he thinks border taxes are too complicated, but then within a couple of days he’s offered them up as a threat to prevent US companies from locating factories overseas. Last on the list, allowing for the repatriation of overseas cash at a low one-time tax rate.
Judging by stock prices, we think it’s fair to say that investors have rapidly bought into the positive aspects of many of these potential developments. What’s less clear is how easy it will be to push through each new piece of legislation and whether there will be any side effects.
Market developments. While stocks have shot higher post-election, on the other end of the spectrum high-grade bond values have declined since the election due to rising interest rates. The common view is that pro-growth policies will result in higher inflation and higher rates. The dollar amounts associated with declines in bond prices are probably larger than the increases derived from stock gains. So, for the average investor with balanced portfolios, they might not have made much money over the past couple of months.
The US dollar was also very strong in November, as the prospect of rising rates increases the relative attractiveness of the currency versus other nations where central banks are still stuck in the basement – not that we aren’t. The dollar reached multiyear highs versus other currencies within the past month or so, but it has given lots of that back in recent weeks.
Investors are arguing that most of these proposals will lift corporate earnings and economic growth, so we want to walk through the conventional view on each one. So, on lower taxes they’re supposed to lift earnings and incite animal spirits. Cutting regulations will reduce businesses’ cost to operate. Capex investment will grow if companies can write off capital spending immediately. Infrastructure spending will boost GDP and benefit connected industries. A repatriation holiday will bring cash back to the US that can be used for M&A, dividends, and share repurchases. And lastly, border taxes will protect American jobs and help reduce the trade deficit.
So, Newton’s law says that “For every action, there is an equal and opposite reaction.” And Isaac Newton actually lost quite a bit of money investing in the stock markets, the South Sea Company, many, many years ago. It’s a story many people know about. So, we wouldn’t argue that there is a negative effect of each policy that’s being proposed that’s going to be proportionate to the positive impact that’s embraced by Wall Street right now, but we do think investors are overlooking that there is a price to pay for implementing most of these policies.
In some cases, the cost matters in the long run while the benefits are immediate, so for many people that’s good enough. But let’s walk through the various policies one more time. So, on taxes, lower taxes are going to benefit many firms. That benefit will be greater for domestic-focused companies. However, large multinationals already enjoy low tax rates, and in some cases they have lower effective rates than President Trump is currently proposing. Also, in terms of smaller firms, a lot of them are losing money. A lower percentage of zero is still zero.
On the dollar, the administration is finding itself in an ironic predicament of a strong dollar that is going to make it very difficult to achieve many of the trade-related goals that have been stated. A higher dollar hurts translated foreign earnings for companies, and it also pressures exports, so it’s a headwind to reducing the trade deficit and rebuilding the manufacturing base in the country.
Infrastructure spending. Look, it’s certainly not difficult to cite examples of US infrastructure that could use a facelift. However, we’d argue that it’s worth looking at past stimulus programs and assessing how they turned out, and we wonder how prudent it is to launch a program like this for the main purpose of goosing GDP in the near term. Eventually, someone has to pay the bills.
On the deficit, while government debt is something that most people are comfortable ignoring for another day, at some point huge deficits are going to catch up to us, and it will matter much sooner if interest rates keep rising. We think tax cuts should be paired with spending reductions. The new administration includes appointees with very divergent views here; we’re concerned President Trump is going to be more aligned with those in the pro-spending camp.
As far as repatriation, we feel like the upside to a repatriation holiday is probably overstated. First of all, many investors are already recognizing overseas cash when they value businesses. And frankly, in the vast majority of these cases they have not discounted this cash for the extra taxes they will pay if the cash is brought back onshore. Second, we’re not convinced a repatriation holiday would actually lead to smart investments in the US economy. It hasn’t been difficult for blue chip companies to secure capital, and we doubt many positive NPV projects have been deferred due to a lack of access to cash. Now, a repatriation might lead to more buybacks, which would destroy value since most of the market is overpriced, in our opinion. The same is true for M&A. For every winner – the shareholders of the target – there will be losers – or the shareholders of the acquirer – if they use repatriated cash to overpay. If we were running these companies, we’d advise them to use any repatriated cash to pay down debt.
Border taxes, tariffs, and tweets could all give rise to trade wars. We hope that doesn’t happen. We’re not sure how much good will come from anything in this group, but we would recognize that some firms could fare better than others. The prevailing view is that a broad-based border tax will lead to further appreciation of the dollar, which will exactly offset the impact of the tax. If that happens, the tax won’t have accomplished what the administration intends. With that being said, it will provide revenue to the government to offset the losses from corporate tax rate reductions. Our instinct is that the currency adjustment might not be as complete as predicted by economists, which means the border adjusted tax could be disruptive to certain companies and industries and helpful to others.
Lastly, what about interest rates? In the old days, rising interest rates led to a contraction in the valuation multiples assigned to equities. This hasn’t happened yet this round. We think it eventually will if interest rates keep rising as fixed income becomes more attractive. We’re arguably still a long way away from fixed income being attractive by historical standards, but we’re also at an all-time stock market high, not only in terms of prices but also in terms of multiples when you look at the median company.
I’m going to give the microphone to Jason Lazarus now.
Jason Lazarus:
Thanks, Jayme. Let’s take a look at three of our portfolio companies and analyze how they might be impacted by Trump’s proposals. We’ll start with Cubic. Cubic is the world’s leading provider of automated fare collection systems for mass transit. It is also a market leader in air and ground combat training systems. As a US taxpayer, Cubic would obviously benefit from lower corporate taxes. The firm pays a low rate on its debt load, so not being able to deduct the interest expense would have a minimal impact relative to the enterprise value. Capex is also low, so Cubic would experience little benefit from immediate depreciation. Cubic could benefit materially from an increase in infrastructure and military spending. There’s no regulatory impact, but the company would benefit from both a border tariff and the ability to repatriate its foreign cash at favorable rates. Overall, we think Trump’s proposals would have a positive impact on Cubic.
Corus Entertainment is one of the firm’s largest holdings. The company is the largest independent owner of television stations in Canada and has leading positions in women’s, children’s, and family programming. Corus is headquartered in Canada and does nearly all of its business in the country. Therefore, President Trump’s policies are likely to have little if any impact on the company.
Lastly, let’s consider one of our newer purchases, Syntel. Syntel provides IT outsourcing primarily to US companies by using a large Indian workforce. As a US-based company, Syntel would clearly benefit from lower taxes. The firm has a relatively small debt load, so interest deductibility would have only a minor impact. Capex expensing and government spending would have little impact as Syntel’s capex is very low as it is and it has no exposure to the military or infrastructure. However, Trump’s “America First” stance could potentially be harmful to the business. First, regulatory reform regarding America’s visa program would make it difficult for Syntel to maintain its physical presence in the US. The company currently has 14 percent of its workforce in the US under a visa program. Under a worst case scenario, Syntel would have to react to sweeping visa reforms by finding Americans to fill these roles, which could be difficult as we believe there is a shortage of Americans with the high tech skills required.
Additionally, the firm would need to raise prices and move labor back to India in order to maintain its margins. The border tariff would also negatively impact the firm. 75% of the company’s employees are located in India. While these employees are paid significantly less than their US counterparts, the cumulative expenses that would be subject to a border tariff could be significant. That being said, the negative impact of a border tariff is expected to be offset by corresponding changes in foreign currency rates.
Let’s talk about what’s priced in. This chart shows the Russell 2000 Index in gold and the enterprise value to EBITDA multiple in blue. You can see that markets reacted negatively immediately prior to the election when FBI Director Comey reopened the Clinton e-mail investigation, causing Trump’s odds to improve. Stocks continued to slide into election day as a Trump victory appeared more and more possible, but investors were quick to change their minds and embrace Trump’s “America First” policies, sending the Russell 2000 up nearly 14% through the end of the year.
Our analysis of Russell 2000 companies suggests that of the half that have positive earnings in the first place Trump’s proposals could positively impact earnings by 15%. While this appears material and would suggest the jump in stocks is warranted, let’s examine a longer period than just the last year. As you can see here, the Russell 2000’s multiple is almost twice its historical average. Likewise, the yield on high-yield bonds was already bouncing around the lowest levels in history.
Open economies are extremely complex systems with many moving parts to consider. Some of trumps proposals are more likely to succeed than others. The macro impact may not be uniformly positive, and it also may be temporary. As we’ve shown with Cubic, Corus, and Syntel, the impact of Trump’s proposals can vary widely. And even if the proposals are uniformly good for the economy, rising interest rates should lead to higher discount rates and lower multiples. Additionally, it appears that investors are ignoring longer-term debt and deficit challenges. Our investment process acknowledges potential headwinds and tailwinds on individual businesses, and we will continue to emphasize valuations in every decision.
I’m going to turn it back over to Matt for questions.
Q&A
Matt Berquist:
Thanks, Jason. At this time, we’ll open it up to questions. You can go to the question tab on your dashboard there and just simply type your questions in. We’ll answer them as they come in. So, we’ll give you a second for those to queue up.
So, while we’re waiting for questions to come in, why don’t we do a Super Bowl poll in here? Mark, you go first.
Mark Travis:
I’ll take the Patriots and give three. [Laughs] Even without the Gronk.
Matt Berquist:
Greg, what are your thoughts?
Greg Estes:
It’s hard to go against the Patriots.
Matt Berquist:
Ben?
Ben:
Pats. I think it’s unanimous. Pats.
Matt Berquist:
You too, Jayme?
Jayme Wiggins:
I mean, I’m rooting for the Falcons. [Laughter] I don’t necessarily expect them to win.
Matt Berquist:
All right, I’ll go and record and say if Clemson can beat Alabama, then the Falcons can beat the Patriots. All right, we’ve got our first question coming in: “Do you use technical analysis in assessing overall market conditions, such as advance decline line, etc.?”
Jayme Wiggins:
I can answer this question very succinctly. We do not. It’s not part of our process. We’ve never used it. It’s just not something that we do.
Matt Berquist:
All right, the next question: “How is cash invested, if at all? Is it producing any yield?”
Jayme Wiggins:
I can handle this one, too. Within the past quarter we’ve actually gravitated back toward T-bills. Right around– shortly after the election we were able to get 50 basis point type yields on short-term Treasuries. These are typically about three months before maturity. If you go back a decade, our cash was also invested in T-bills earning a lot more – four percent plus – shortly before the credit crisis crash. But the cash has mostly been cash for the past several years until this past quarter. But it’s mostly in T-bills now.
Next question: “What is the average enterprise value to EBITDA multiple of the Intrepid Capital Fund?”
Mark Travis:
This is Mark. I’ve scrambled to a Bloomberg to look that up and it’s not quoted directly, but my guess is materially lower than the Russell 2000, which we just showed you is north of 21. I’m showing something on a Bloomberg that’s north of 8, and my guess is it’s probably more like 11 or 12, if I had to guess.
Jayme Wiggins
Yeah, I mean, I would second that it’s definitely going to be lower than the statistics you’re seeing for the Russell 2000. If you think about when we buy companies, we put up these charts on EBITDA because it’s easier to see long-term trends than it is if you look at free cash flow. But we actually emphasize free cash flow in our valuations, and when we’re valuing things it’s very common for us to value a company at, let’s say, 15 times free cash flow. Maybe some companies that have higher growth profiles or less risk we could value as high as 20 times, and others with higher risk we could be 12 times or less. But if you think about 15 times free cash flow, that’s our valuation, so how does that translate into an EBITDA multiple? Well, it depends on the capital intensity of a business, it depends on the tax rate and a lot of other things, but I would say across our firm for operating businesses that generate free cash flow we’re probably at EBITDA multiples that are in the high single digits.
Matt Berquist:
The next question is: “Can you go over the brief difference of each of your equity funds?”
Mark Travis:
This is Mark. I’d be happy to. I think there’s some material differences, although there’s obviously some overlay in all of the funds. But in the first case, the Endurance Fund is a small cap value, absolute return-focused fund. And the evaluation work that’s done there, if there’s not a material discount to be found in the small cap, generally US equity universe, we default to cash. In the Capital Fund, it’s kind of a bouillabaisse of what we do here, as I would like to say. It’s a combination of both large, small, and international equity, generally constrained probably south of 60-65% a day. It’s more like 50% equity, short duration, high yield debt, and then cash – which today is somewhere in the mid-teens. The Discipline Value Fund is mid to large cap US equity with a sprinkling of small here and there and some international. The Income Fund is largely short duration, high yield US debt. There are a few equities where we’ve very comfortable with both the dividend rate in absolute terms and the underlying equity value.
In addition to that, our two newer offerings – Greg showed a chart of the International equity fund, which now has crossed its second birthday. We’re strictly looking across the globe in developed markets. We have no equity investments in North Korea, Cuba, or Iran at this point. So, we are looking in France, the UK, Australia. I for one would like to have a field trip to Australia, but I can’t get anyone here to vote with me on that. And then, lastly, the Select Fund, due to popular demand and minimization of our cash and strictly our equity valuation work, it’s a small to mid-cap value equity fund, cash constrained around 10%.
Matt Berquist:
Thanks, Mark. I’m not seeing any other questions in the queue. I’ll give that a little bit more time here. We’ve been going for about 40 minutes. I sure appreciate everybody taking time this morning to join us. And if we don’t have any other questions, we’ll thank you for your continued confidence in our process and our discipline here at Intrepid Capital Funds. We’ll be at the Morningstar conference in April, which is – might be a little chilly this year in Chicago. But don’t hesitate to call us with any questions or if there’s anything we can do with you in the meantime.
Thanks, and have a great day.