Performance
Performance data quoted represents past performance and does not guarantee future results.
Investment returns and principal value will fluctuate, and when sold, may be worth more or less their original cost. Performance current to the most recent month-end may be lower or higher than the performance quoted and can be obtained by calling 866-996-FUND. The Funds impose a 2% redemption fee on shares held for 30 days or less. Performance data does not reflect the redemption fee. If it had, returns would be reduced.
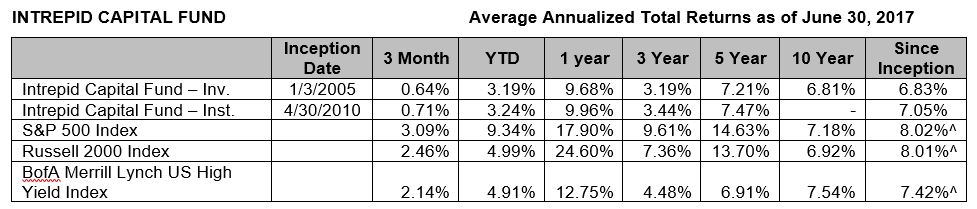
^Since Inception returns are as of the Fund’s Investor Class inception date. Since the inception date of the Institutional Class, the annualized return of the S&P 500 Index is 12.85%, Russell 2000 Index is 11.49%, BofA Merrill Lynch US High Yield Index is 7.49%.
Per the Prospectus dated January 31, 2017, the Fund’s annual operating expense (gross) for the Investor Shares is 1.45% and for the Institutional Shares is 1.40%. The Fund’s Advisor has contractually agreed to waive a portion of its fees and/or reimburse expenses until January 31, 2018 such that the Net Expense Ratio for both the Investor Shares and Institutional Shares is 1.15%. The Net Expense Ratio represents the percentage paid by investors. Otherwise, performance shown would have been lower.
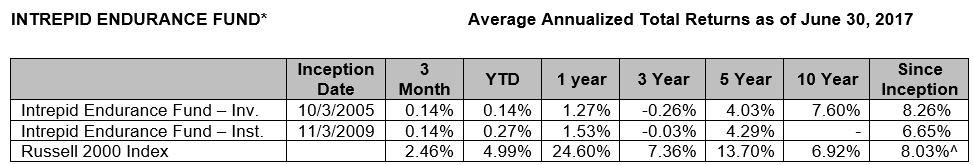
^Since Inception returns are as of the Fund’s Investor Class inception date. Since the inception date of the Institutional Class, the annualized return of the Russell 2000 Index is 14.16%.
Per the Prospectus dated January 31, 2017, the Fund’s annual operating expense (gross) for the Investor Shares is 1.46% and for the Institutional Shares is 1.40%. The Fund’s Advisor has contractually agreed to waive a portion of its fees and/or reimburse expenses such that the Net Expense Ratio for both the Investor Shares and Institutional Shares is 1.15%. The Net Expense Ratio represents the percentage paid by investors. Otherwise, performance shown would have been lower.
*Effective 6/26/2015, the Intrepid Small Cap Fund was renamed to the Intrepid Endurance Fund.
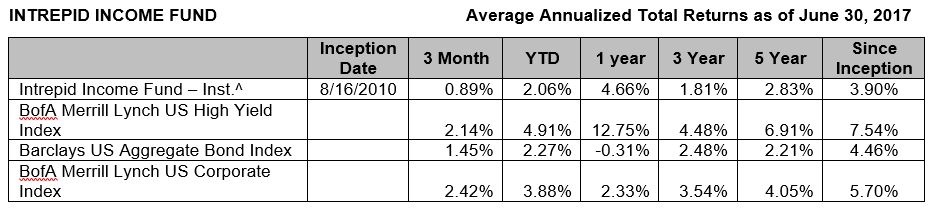
^Institutional Class shares of the Intrepid Income Fund commenced operations on August 16, 2010. Performance shown prior to August 16, 2010 (2008-2010) reflects the performance of Investor Class shares, which commenced operations on July 2, 2007, and includes expenses that are not applicable to and are higher than those of Institutional Class shares.
Effective January 31, 2014 the Investor Class shares of the Fund were closed, and any outstanding Investor Class shares were converted into Institutional Class shares.
Per the Prospectus dated January 31, 2017, the Fund’s annual operating expense (gross) is 1.03%. The Fund’s Advisor has contractually agreed to waive a portion of its fees and/or reimburse expenses such that the Net Expense Ratio for the Fund is 0.92%. The Net Expense Ratio represents the percentage paid by investors. Otherwise, performance shown would have been lower.
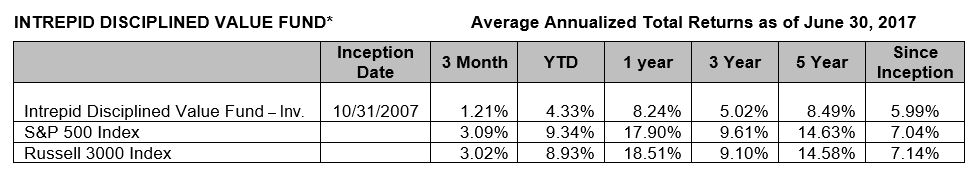
Per the Prospectus dated January 31, 2017, the Fund’s annual operating expense (gross) is 1.34%. The Fund’s Advisor has contractually agreed to waive a portion of its fees and/or reimburse expenses until January 31, 2018 such that the Net Expense Ratio for the Fund is 1.30%. Otherwise, performance shown would have been lower.
*Effective April 1, 2013, the Intrepid All Cap Fund was renamed to the Intrepid Disciplined Value Fund.
Per the Prospectus, the Fund’s annual operating expense (gross) is 2.50%. The Fund’s Advisor has contractually agreed to waive a portion of its fees and/or reimburse expenses until January 31, 2018 such that the Net Expense Ratio for the Fund is 1.40%. Otherwise, performance shown would have been lower.
Per the Prospectus, the Fund’s annual operating expense (gross) is 3.02%. The Fund’s Advisor has contractually agreed to waive a portion of its fees and/or reimburse expenses such that the Net Expense Ratio for the Fund is 1.40%. Otherwise, performance shown would have been lower.
Short term performance, in particular, is not a good indication of the fund’s future performance and an investment should not be made solely on returns. Performance data quoted represents past performance and does not guarantee future results.
40 second intro for disclosures and performance…
Mark Travis:
Good morning. This is Mark Travis, President of the Intrepid Capital Funds. I’d like to welcome you to our semi-annual webinar. Before we get started, I just had some opening remarks and then I’m going to pass the mic here momentarily.
Again, I think for those of us at Intrepid Capital, we find ourselves in a challenging environment and that we – as you’ll see in a moment – really try to carefully underwrite each security that we purchase on your behalf or for our fund shareholders in each fund. In simplicity, we’re trying to find a disconnect between market price and private market value in the equity market. And in the fixed-income market, an attractive spread to risk-free rates with a simple “How are we going to get our money back?” if, as I like to say, “something goes bump in the night.”
Just anecdotally, I think that there’s some indications to me that kind of remind me of the late 90s in terms of the equity market. Most recently, the Snap IPO where you had a 20-something-year-old CEO raise hundreds of millions of dollars without any provision for other shareholders. Those shares, I might point out, are down from their initial offering earlier this year. That was in the equity market. Then, in the fixed-income market, Argentina – which has had numerous political problems and actually defaulted in the last several years on their sovereign debt – was able to go out and issue 100-year debt, which I would note the U.S. Treasury is also considering. But, in the case of the U.S., we have not defaulted; Argentine debt has defaulted. They were offering 100-year debt at very nominal yields and it was actually over-subscribed. So, it kind of shows you – at least it does to me – the ebullient market for equity and debt as rates are starting to rise underneath us.
Intrepid Capital Funds we are, as I would say, turning over a lot of rocks, looking in unusual places across the globe. Certainly, there have been no macro events to cause a lot of mispricings, but we have been able to find some micro ones. So, I’m going to turn over the floor here in just a second to Jayme. We’re going to talk a little bit about – it kind of reminds me of the 40th anniversary of Jaws: What Lies Beneath. In our observations, looking closely at companies. A lot of times what the public perception is and, what we titled this webinar as, “What Lies Beneath” is quite different.
So, Jayme’s going to spend a little bit of time talking about equity valuations, particularly the well-known FANG securities. He’s got a little take-off on FANG. After Jayme’s done, Matt Parker – who is our resident CPA, after five years at E&Y, he’s joined us in the last several years – he’s going to talk about GAAP and non-GAAP earnings adjustments. When Matt’s finished, Jason Lazarus who leads our income fund is going to talk about the high-yield market and what’s happening there.
So, without further ado, I’m going to turn over the floor to Jayme Wiggins and we’ll take questions at the end. Thank you for listening in today.
Jayme Wiggins:
Thank you, Mark. So, the catchy hit single, “Gangnam Style” was released on July 15, 2012. Millions of people, maybe some of you listening to this call, tried to imitate the dance moves in the video. “Gangnam Style” became the first YouTube video to reach one billion views. This song was released only two months after the IPO of Facebook, which was effectively the inception date for the FANG group of stocks we have all heard so much about recently.
The FANG acronym was created by CNBC’s Jim Cramer in reference to Facebook, Amazon, Netflix, and Google. This may be the only time you’ll ever hear us cite Jim Cramer in our communications with you. There have been several variations to the FANG name in recent years, but we’ve settled on FANGAM, including Apple and Microsoft, as a good grouping that captures investor excitement over new technologies like social media, mobile streaming, and the cloud.
There has been an abundance of press coverage lately about the stock markets’ gains being driven by a few big companies. First, let’s talk about the Dow. The Dow Jones Industrial Average is a price-weighted index which means companies with higher stock prices have a larger impact – even if they aren’t larger companies. For instance, Boeing has the highest stock price of any Dow company at about $239 per share. But, Boeing is only the 20th largest company in the Dow by market capitalization. Travelers, the insurance company, is the smallest Dow component, but it has a bigger impact on the index than Microsoft – which is 17 times its size – because Travelers has a higher stock price.
On a year-to-date basis, three stocks in the Dow account for half of the 30-stock index’s 11% gain. Boeing, Apple, and McDonalds. The S&P 500, in contrast to the Dow, is a capitalization-weighted index so its underlying drivers are very different than the Dow. Nevertheless, we’ve witnessed the same phenomenon of a handful of stocks accounting for a large portion of the gains. Specifically, the FANGAMs account for about 38% of the year-to-date gains in the S&P, while these same companies represented only 12% of the index’s beginning market cap on January the 1st.
The investment firm, AQR, has debunked the idea that recent gains in major market indexes are unusually concentrated. They’ve pointed out the obvious, that the biggest companies by market cap are often the main contributors to the returns of a capitalization-weighted index. However, the FANGAM stocks have been propelling returns for several years even when they weren’t the biggest companies by market cap.
We think the behavior exhibited by the FANGAM stocks in recent years is special. These six stocks have had a huge impact on the S&P over the last four years and the magnitude of this impact is rare. We decided to track the performance of the FANGAMs since the S&P exceeded its pre-credit-crisis high which occurred in April 2013. We picked this date because we think it’s somewhat symbolic of when the markets overvaluation kicked into high gear. In April 2013, the FANGAMs accounted for 7% of the market cap of the S&P 500. Since then, these stocks have driven 27% of the market’s gains. Their cumulative return is 188%. The S&P 500’s return excluding the FANGAMs is about 39%.
It won’t surprise you that the technology-centered FANGAMs, excluding Netflix, have impacted the Nasdaq even more. They account for over 60% of the year-to-date gains for the Nasdaq 100 index. More interestingly, the ratio of the capitalization-weighted Nasdaq 100 to the equal-weighted Nasdaq 100 is near the highest on record. In the equal-weighted version of the index, every stock has the same performance impact. The high ratio of cap to equal-weighted is occurring because the biggest stocks – the FANGAMs excluding Netflix – are performing the best.
So why do you care? As far as Intrepid is concerned, we like to own stocks that will go up. But we’re less enamored with stocks that have increased a lot already. To be fair, most of the FANGAMs are growing businesses and in some cases, the past price growth may be justified, but they each have very different levels of profitability. What we won’t do at Intrepid is chase popular stocks higher as a momentum bet, which unfortunately is what is occurring today on the part of both active, and more critically, passive funds.
Switching gears a bit here, but sticking with the tech theme, most investors will tell you that the tech bubble was the biggest stock market bubble ever. The most often-cited piece of separating evidence is a chart of the historical Shiller P/E of the S&P 500. The Shiller P/E is a cyclically-adjusted earnings metric that averages that prior ten years’ earnings after inflating them to current dollars. We like the metric because it helps incorporate the business cycle into the P/E. The Shiller P/E was highest in 1999 and today it’s at its third-highest level ever, just below the 1929 peak.
Some people argue that the Shiller P/E overstates the market’s expensiveness because it currently incorporates the weak earnings that occurred right after the credit crisis. We strongly disagree since the whole point of the P/E is to reflect the business cycle, not just good periods. Nevertheless, alternative measures have popped up as of late, including a Hussman P/E which measures the index on peak earnings, and even a PEG ratio or a P/E-to-growth ratio. All of these metrics indicate we are in the midst of a very expensive market.
As investors that spend a lot of energy looking for mid-cap and smaller-cap stocks at Intrepid, we prefer another metric. One that focuses on the average company, not the weighted-average index. We tracked the median P/E for the Russell 3000 which represents 3,000 of the largest public companies in the U.S. with market caps ranging from $41 million all the way up to $842 billion, which is Apple. The Median company’s P/E is currently 45% above where it was during the tech bubble. It’s also significantly higher than it was during the housing bubble. The only time the Median P/E has been higher over this period is when earnings collapsed, but that would be expected. You don’t expect a record-high P/E on near record-high earnings, which is where we are today.
The takeaways for us are; number one, mean values can be distorted by outliers. The Shiller P/E during the tech bubble was carried by big-cap tech stocks like Intel and Cisco. Number two, be skeptical when you read that today’s market is not as expensive at the tech bubble. Today’s market overvaluation is much broader than past cycles. It’s not just a few stocks or frankly even just a single asset class. Literally, almost every asset is priced yearly. Lastly, the typical company has never traded at such a high multiple. In other words, it’s never been harder to find a cheap stock.
Now it’s Matt’s turn to talk about GAAP.
Matt Parker:
Thanks, Jayme. So, I want to start out by taking a look at the price-to-earnings multiple of the Russell 2000. We’ve included three different measures here. On the left column of the chart, we have the P/E using adjusted earnings and excluding all unprofitable companies. In the middle, we have the P/E using adjusted earnings but including the earnings from unprofitable companies. We can see that the multiple changes from 20x to 46x showing the pervasiveness of unprofitable companies in the index. Finally, on the right-hand side, you can see the 87x P/E multiple using earnings accorded to Generally Accepted Accounting Principles, or GAAP. This is the largest discrepancy and is almost double the Non-GAAP P/E multiple. We’d like to focus on this GAAP vs. Non-GAAP topic today and take a closer look at what types of adjustments contribute to this difference.
Here, we’ve listed a few of the common adjustments that we find in companies’ calculations of their adjusted earnings. We typically see things like stock compensation, impairments and write-downs, restructuring charges, changes in pension assumptions, and other items. The question is, are these adjustments really unusual or non-recurring?
Let’s take a look at an example from a publicly-traded golf course operator. On the left-hand side, we’ve shown their calculation of adjusted earnings and on the right-hand side, we’ve shown the calculation of adjusted EBITDA. We place red boxes around items that are, maybe, questionable at best. For instance, their adjusted earnings calculation – not EBITDA – includes an add-back for depreciation expense. Their adjusted EBITDA calculation adds back recurring operating expenses for golf carts and equipment lease costs. Now how do we think about adjusted earnings calculations at Intrepid? We evaluate each item individually and consider which are truly recurring economic costs.
Another common adjustment that we see is stock-based compensation. Now, the measurement is somewhat complicated and the rationale that many give for adding it back to adjusted earnings is that, “Well, it’s non-cash, there’s no impact on free cash flow, and the effect is captured in diluted EPS.” To see if this is true, let’s look at an example. Here, we show the GAAP losses of Twitter during its public history as well as the stock-compensation expense that they booked. You can see how large the expense is in relation to their GAAP earnings. In fact, for most periods, if you added the stock-compensation back, you’d go from negative earnings to positive earnings.
On this next chart, we show the economic impact of the stock-compensation. You can see that Twitter’s share count has risen from 570 million in 2013 to 736 million in 2017. This represents dilution of nearly 30% to the stock holders and certainly qualifies as a real expense. We can also see that it’s clearly been a recurring way for Twitter to compensate its employees. Finally, we would argue that the stock-compensation effect is not completely captured in the calculation of diluted EPS. As we showed on the previous slide, for most years, the adjusted diluted EPS would be positive while the unadjusted EPS would be negative. Here at Intrepid, we always include the stock-compensation in our earnings calculations for equity investments. But, if you don’t want to take it from us, maybe you’d prefer to hear the opinion with someone with a bit more credibility.
Here, we have a quote from Warren Buffett where he says, “Stock-compensation is the most egregious example. The very name says it all: ‘compensation.'”
Next, I’d like to transition to the topic of earnings growth. One of the things that we often read is that valuations are justified by the strong growth and corporate profits. We would argue that growth and real profits is not as strong as many suggest. The chart on this slide shows aggregate profits of U.S. companies over the last decade. As you can see, there really hasn’t been a whole lot of growth over the last five years. Now, you might point out that this chart doesn’t necessarily jive with other charts that you may have seen that show strong growth in earnings from companies, say in the S&P 500; how can this be so?
There’s a few factors that impact per-share earnings in stock indexes that aren’t captured in aggregate profit measures. First, the index profit measures are generally Non-GAAP. We’ve already shown how these earnings can be misleading. Second, index growth includes earnings from acquired companies. Third, per-share growth can be manipulated by stock buy-backs.
Acquisitions can be a significant component of growth. Over the past year, companies in the S&P 500 have completed 1,107 total acquisitions. Of these, 267 have been acquisitions over 100 million, which we would call significant. As we kind of half-jokingly suggested in the title, the S&P 500 effectively became the S&P 767 within one year. Now, what’s our view of growth from acquisitions? We generally focus more on companies’ organic growth. When acquisitions are made, we evaluate prices that are paid and look out for unrealistic projections of synergies.
Another illusion of growth occurs when a company buys back its stock. The best way to illustrate this is with a brief example. Let’s use a hypothetical business called Financial Engineering Company. Suppose this company has sales of $100, an operating margin of 15%, and a 33% tax rate. Further assume that there are 25 shares outstanding and that the stock trades at a P/E multiple of 20 times. This results in earnings of $10, EPS of $.40 per share, and a stock price of $8.
Now, let’s assume that this company’s bankers convince the company to take advantage of today’s ultra-low interest rates to issue debt and buy-back their stock. Suppose they issue $80 of debt at a 4% interest rate and repurchase 10 of their 25 shares outstanding. What’s the effect on earnings? Well, the operating profit remains unchanged at $15. But, after paying the interest expense, total earnings fall 21% to 7.9%. But, the earnings per share rise 31% from $.40 to $.52 per share. The reason is that the after-tax interest rate on the debt is lower than the earnings yield of the stock. So in this case, the interest rate – which is 4% pre-tax – is lower than the earnings yield of 5% which is simply the inverse to the P/E ratio.
This financial engineering looks good, but it doesn’t necessarily add value. At Intrepid, we compare the price the company pays to repurchase its stock with our estimate of the stock’s intrinsic value. We also consider the additional risk of adding more debt to a company’s capital structure. Finally, we usually analyze earnings relative to a company’s enterprise value rather than solely focusing on the P/E ratio.
As you can see in this chart, stock buy-backs have been a popular use of capital by S&P 500 companies recently. The only other thing I would highlight in this chart is the notoriously poor timing that companies have historically had when buying back their stock. For instance, buy-backs peaked in the last cycle, stock prices were also peaking, in 2007. They reached a trough when stock prices were cheapest in 2009. With that, I’ll turn it over to Jason to discuss the high yield market.
Jason Lazarus:
Thanks Matt. Switching gears to fixed income, I’m going to use the next few minutes to provide an update on the state of the high yield market. A common refrain in high yield over the last couple of years is that while yields appear near historic lows, spreads are still near average levels and are well above levels seen in the mid-2000s. The option-adjusted spread on the Merrill Lynch High Yield Index is currently 385 basis points; while the lows hit in 2007 were close to 240 basis points.
While this claim appears to be true, if we remove distressed funds from the Index – those issues trading at 1,000 basis points or more over Treasuries – the option-adjusted spread drops by 60 basis points to 325. The bonds removed make up less than 4% of the Index. Non-distressed yields are just 90 basis points from the lows reached in 2005.
Investors are happily investing at the lowest spreads in years, while fundamentals appear to be deteriorating. According to Moody’s covenant rating system, covenant quality in recent months is close to the weakest ever. June had the highest concentration of convenient lite bonds on record, meaning investors required the least contractual protections.
Furthermore, corporate leverage ratios are at the highest levels in years. 80% of large corporate issuers have debt-to-EBITDA ratios greater than 4 times. And 50% are greater than 5 times. Leverage exceeds levels experienced in the years before the credit crisis.
Let’s ignore spreads for a moment and look at the actual yields offered by non-distressed high yield bonds. The rate is near the lowest levels of all time and close to where the Fed Funds rate was 10 years ago.
Some market commentators claim that 5% is relatively attractive, but is this really true? Grant’s Interest Rate Observer wrote an interesting piece lately that included a study by Marty Fridson. The article outlined an issue that we have been concerned with for some time. If we assume the historical default rate of 4.5%, and assume those defaulted bonds have an average recovery of 60%, then the adjusted yield over Treasuries is just 130 basis points. This is nearly equal to the spread offered by investment-grade bonds which have historically had a nearly zero default rate. Furthermore, recent recoveries on defaulted high yield bonds have been lower than historical levels, a trend we believe could continue.
So, what is a bond investor to do? We’ve been focusing our efforts where other investors might not be looking, including smaller bonds, convertibles, preferred stock, and dividend-paying equities. Additionally, we have been consistently reducing risk by buying higher quality bonds, short-term investment grade, and U.S. T-bills.
Q&A
Matt Berquist:
Thanks, Jason. We’ll open it up now for questions. You can use your GoToWebinar toolbox on the right side there to just type your questions in and we’ll answer them as they come in.
While we’re waiting for the questions to populate, just a few side notes. One, you may have noticed that we didn’t really go over any of the performance year-to-date for any of the funds. You can find that at www.intrepidcapitalfunds.com. We also are in the process of updating that website, so we should have a new website for you beginning probably first quarter 2018. That’s exciting. Also, we’ll be at the Schwab conference in November, so please stop by and see us if you’re going to be in Chicago in November.
The first question’s come in: “Where are you finding value in high yield with spreads as low as they are?” Jason?
Jason Lazarus:
This is Jason, thanks for the question. We summarized it pretty briefly at the end of the “High Yield” slides. We’re really trying to look where we think others are not looking. Probably the primary area has been what we call “smaller” issue bonds. The Merrill Lynch Index used to exclude only bonds with 100 million or more outstanding. They recently made a change to that and they increased that limit to 250 million outstanding. So any high yield managers that are screening the benchmark will exclude a pretty sizable number of decently-sized issues. So, we’ve been looking there.
We’ve had some success in busted convertible bonds; those are convertible bonds that were issued with a valuable equity option that has since been made worthless or close to worthless as the stock price has declined over a number of years. The way that we look at those is, we look at it as a straight-bond yield. We generally assess the credit quality and try to compare that to rated bonds; most of the convertible bonds are unrated. Then we look at the equity option as, sort of, free upside from there.
Lastly, we have found some success in preferreds over the last couple of years. We’ve found less of those in the more recent past. One of our biggest holdings over the last few years was Pitney Bowes International Holdings and that was a preferred stock.
Jayme Wiggins:
All right, we’ve started to receive a couple of other questions. I’ll take the second one. “In a market lacking breadth lately and more companies trading below their 200-day moving average, are you seeing pockets of value in equity markets that FANGAM may be hiding?”
I mean, the truth is the markets are still very close to all-time highs. So, in a broad sense, there’s not really much value out there and the situation hasn’t changed. There are a couple of sectors that have been bruised, roughed-up recently. One of those is retail and the other is possibly energy-service companies. There’s a lot of upheaval in both of those spaces. Retail, everyone knows the obvious, Amazon and online shopping. You have to be careful. Just because a retailer’s trading at 5 times EBIT, doesn’t mean that EBIT won’t drop 70% over the next year and stays there. We’re tiptoeing into some of those spaces with looking at new things, but so far we haven’t really bit down on anything yet.
Mark Travis:
This is Mark. The next question was about lack of opportunity: “Some people have floated the idea that as the dumb-money index ceases to be dumb, this leaves only smart money doing accurate analysis as people who are all better and smarter making opportunities scarce. Consequently, prices are more efficient and lack of opportunity will be more pervasive going forward. Thoughts?”
Well, you no longer have to write to a company to request a 10-Q and a K. There’s massive computer power behind the ability to screen as far as maybe a dislocation in price. There may be some validity to that kind of question/statement. There’s currently a magnetic pull from many of our peers who are more relative performance oriented than we are. There are very few absolute return fund shops like Intrepid Capital Funds in my opinion. Anytime you hear somebody quoting their performance within basis points of the index, you know they’re a relative fund manager. Ours is simply to find a good business at a good price and to get an attractive return over time.
Again, to outperform in the long-term, you have to be uncomfortable in the short-term and I don’t think there’s necessarily anybody in this room that’s comfortable with our short-term performance. With that said, and as I think Ben kind of walked through, we are quite pleased with our long-term performance. So, we are looking in lots of different places. I think the next question is related to foreign markets and that’s certainly an area that we are actually searching for value. I’m going to turn the floor over the Ben Franklin to address that question.
Ben Franklin:
Yes, the question is: “Are you finding any interesting opportunities in foreign markets which reportedly are less expensive than the U.S.?” We have been able to find some opportunities, but it’s not like it’s easy or there’s a large number of good ideas to choose from. It still tends to be smaller names, some of them more deep value. We’ve also been able to find a couple of ideas in the UK with Brexit. There might be more pain to come from there, but if we think that it’s fully priced-in, then we may be more active in that area.
I’ve mentioned this in the past, but we have found a few net-nets. One of them is Coventry Group which is going through a turnaround in Australia. So, there are some kind of unique things going on, but it’s not like we’re looking at the market and saying “we’ve got plenty of ideas to choose from.”
Mark Travis:
The next question – this is Mark again – “Versus other previous market tops, how defensive would you consider your positioning?” You know, I think until I was a fund manager I didn’t realize how, maybe, different I was in life. I’m one of the few people that managed to lose a little money in the 1999 calendar year in the tech bubble and then preserve it in some cases, actually make a little, in the financial crisis. If you were to look at our Intrepid Capital Fund today, it’s probably has nominally higher cash levels than it traditionally holds. It’s somewhere in the high teens depending on inflows or outflows. My guess today is it’s probably 17% in cash, 50% equity, some of which is non-U.S., maybe 7% of that is non-U.S. Then, the short-duration debt, more of which recently has been higher quality as rates have come up, we’ve taken some investment-grade short-term positions. And, as rates have come up, we’re able to actually buy Treasury bills for something above the floor in terms of rates.
It’s interesting to me if you look back even a decade ago, you could earn 4, 5, 6 percent in a Treasury of not too long a maturity. That really has not been available to us when we can’t find a suitable investment. But, you know, we’ll keep looking and we’ll see how things play out.
Jayme Wiggins:
Just a quick follow-up on that. I would say, one thing that Mark didn’t mention is I think the ideas within our portfolios are probably less correlated than they’ve ever been to popular benchmarks. So, that’s another measure of defensiveness that might not show up just if you look at cash figures for certain products. Obviously, the Intrepid Capital Fund has our broadest mandate of any of our products, so it has a lot of different areas that it can pick from. Some of our more narrowly-focused products are more cash-heavy. We’re definitely as defensive as we’ve ever been, just in broad terms, on a firm-wide basis.
Matt Berquist:
Okay, it looks like that is all the questions for today. I want to thank everyone for taking time to join us this morning. Please don’t hesitate to reach out to us if you’ve got any other questions in the meantime. Otherwise, thanks again for your business, thanks for your time today, and we’ll talk to you again soon.
[End of Audio]